

Alex's daily Market update & Focuslist - 12/06
Alex's daily Market update & Focuslist - 12/06
.

Good evening folks!
We followed through on yesterday’s reversal and cut through some significant levels today; let’s review everything together tonight!
(have you thought about clicking the LIKE button…thx:))
Alex ✌️

The PrimeTrading community is on DISCORD! 🗨️
We are now over 160 traders in the DISCORD channel!
Join us if you want to see how I execute the trading plan intraday, follow my live trades, and have direct access to an amazing community!!
Alex’s live trades & market commentary
Education & mentoring
Trade side-by-side with me
Discuss trade ideas with a like-minded community
Macro Economy, Crypto & more!
Staying on the right side of the market with a risk management approach first.
GENERAL MARKET ANALYSIS

S&P500 (ES_F) Daily
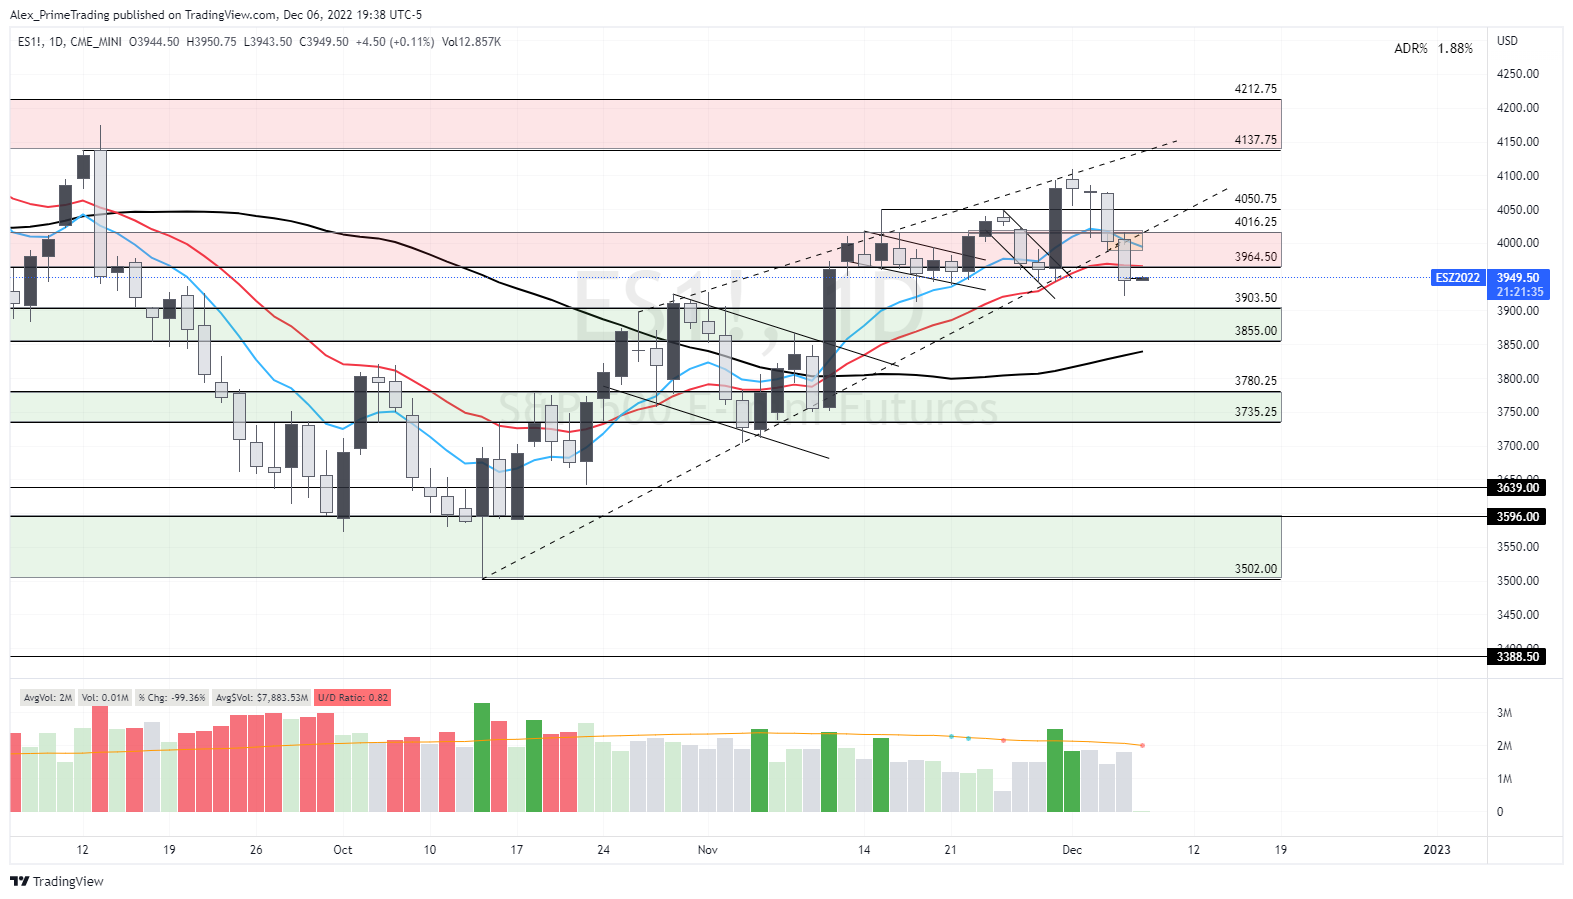
Price Action analysis
we followed through on yesterday’s reversal and broke some critical levels.
We were not able to hold the current rally UTL
We sliced through the 21dma
We broke & closed below the 3964$ level & the entire support (flipped resistance) area.
We could still bounce, but to be honest, the chart looks bad, especially with today’s action.
We are still above the 50dma and essential support area, so if we break down in the next few days, I will look at a potential HIGHER LOW from the October lows as a potential downside target. We’ll take it day by day, level by level.
As usual, we’ll follow price action, but this adds conviction to the rollover scenario right now...
On the upside,
Like I was watching the 4016$ level today, I will be looking closely at the action around the 3964$ level tomorrow if we get back there. How do we act around it…do we reject it on a retest, or do we reclaim it?
The 21dma could also act as a potential resistance on a retest.
On the downside,
3903$ level & area is my next target on the downside.
If we can’t hold that level, the 50dma is the next logical support within reach.
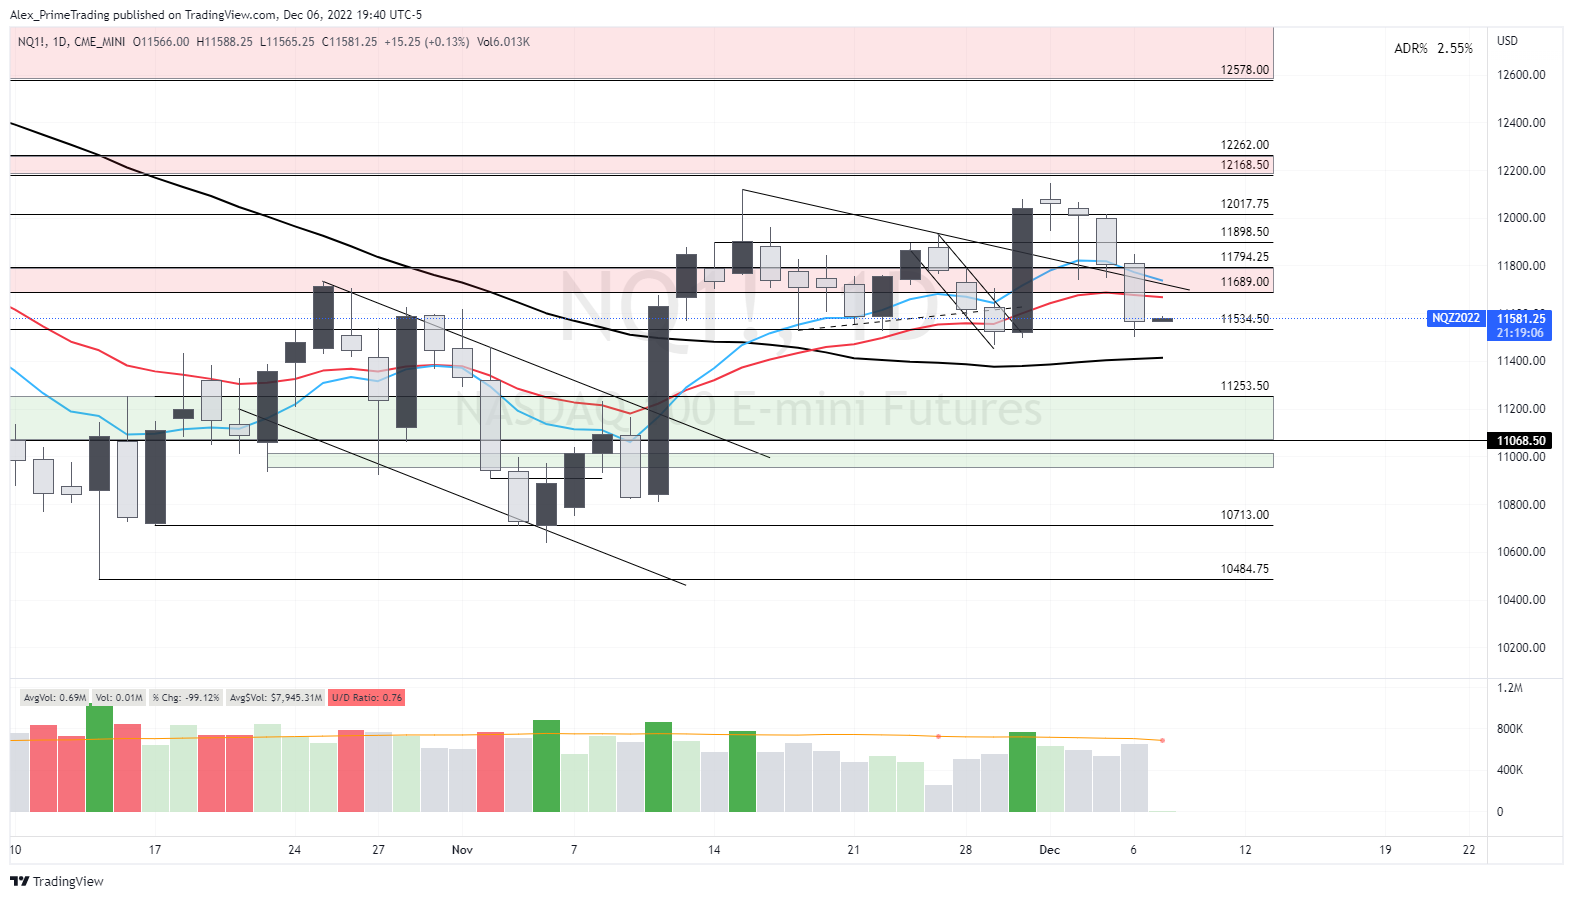
NASDAQ (NQ_F) Daily
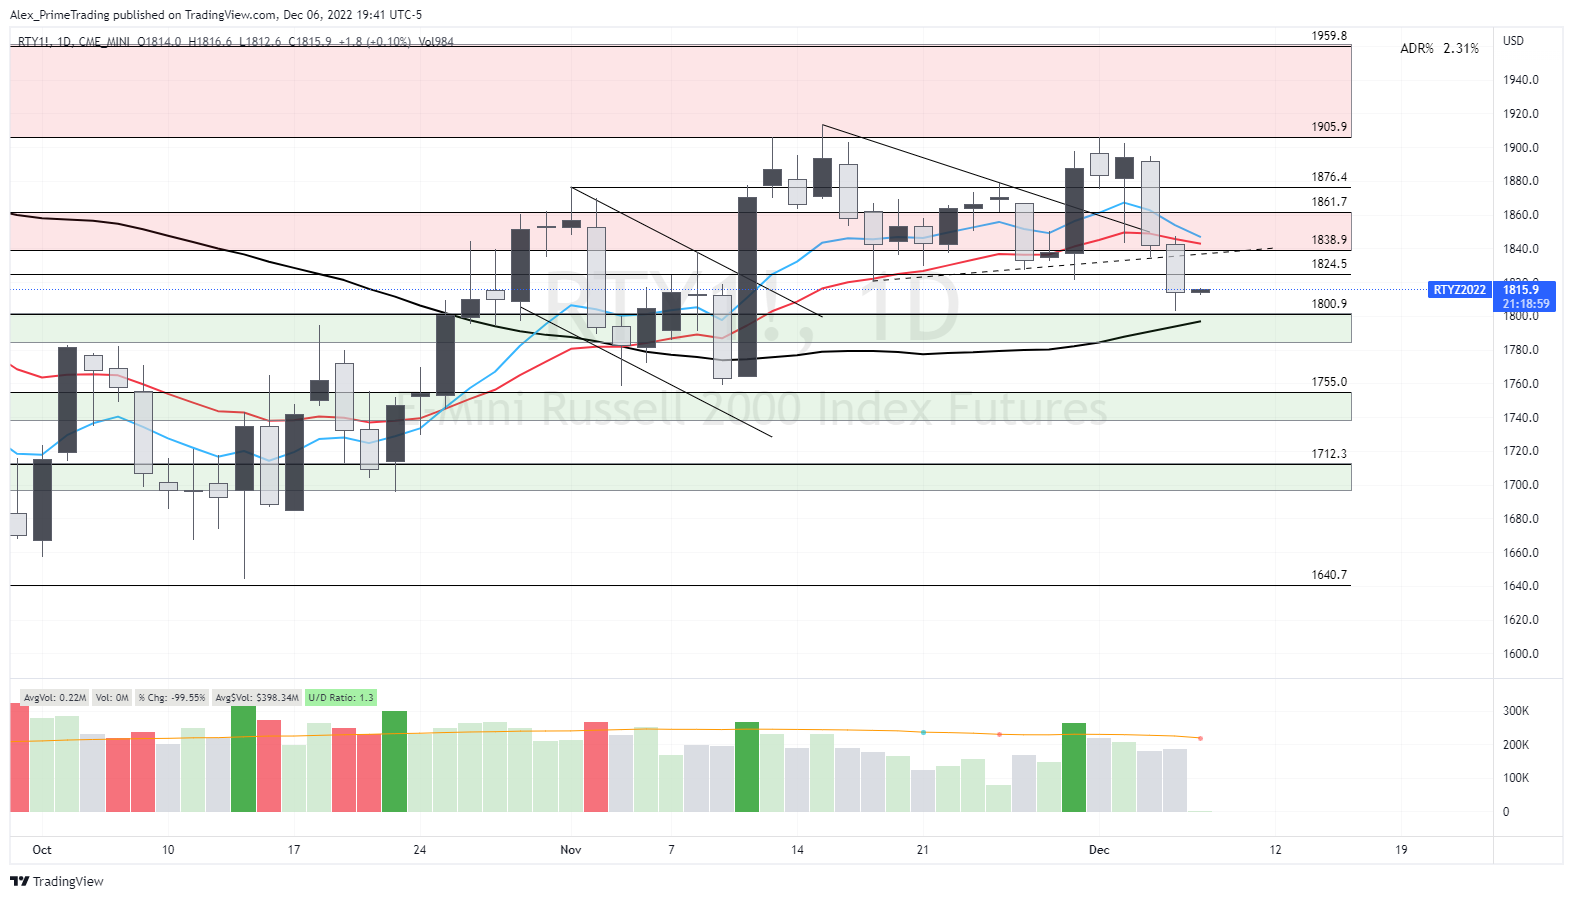
RUSSELL 2K (RTY_F) Daily
Alex’s TAKEAWAYS
Today we followed through, which is precisely what I didn’t want to see to support the short & healthy pullback thesis.
Now, we begin to see more degradations in internals and further destruction in some growth stocks.
I don’t know how far this pullback will go, especially with next week's FED FOMC & important quad witching week…we might very well chop around these levels waiting for the FED next week.
We’ll take it day by day, level by level.
Some observations:
Further key levels break on ES_F (3964$) & 21dma & rally UTL….
Apart from a few leading stocks, there were some actual damages today in my WL/FL/UL. Big moves. (AEHR, ENPH)
VIX channel DTL & 10dma breakout
DXY 105$ follow through on 105$ base reclaim
10Y double inside day
Another hard day for breadth
Leading sectors SMH & XLV acted OK, but TAN & ITA made a nasty reversal. XBI is close to a bear flag UTL breakdown as well.
On the bright side, there are a few stocks that held very well and showed RS. I’ll make sure to review them in the Prime List section tonight.
Like always, I’m always staying alert if the conditions were to change. One step at a time using progressive exposure!
Gameplan:
I added more short exposure today and decided to swing a portion of it for a structure retest on the ES_F. I plan to swing these positions until we retest the 3903$ level/area. I aim to trim more and wait to see how the potential rally is handled.
I would not be too surprised if we chop around that level until next week with FOMC, CPI, etc. (big week)
So I will trim probably 50/75% more exposure and sit on my hands until next week.

PORTFOLIO UPDATE
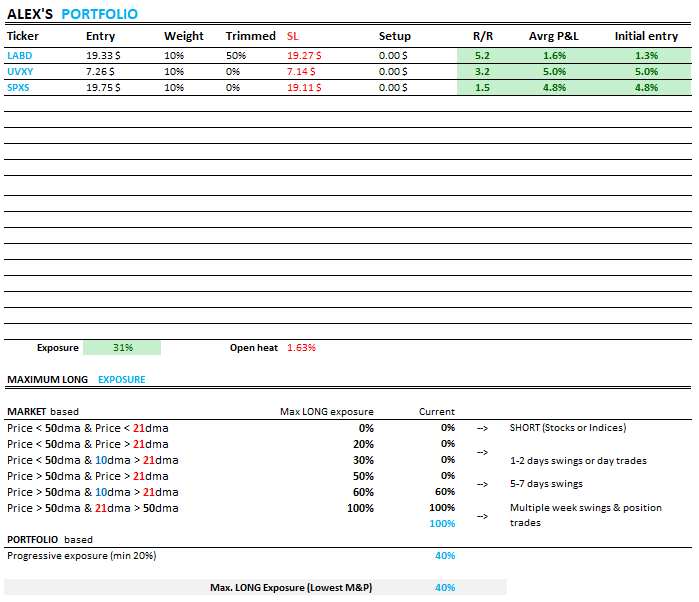
INTRADAY/CLOSED TRADES:

LONG PRIME LIST (RS tracking)
With the current market price action, I don’t plan to open long exposure so that the LONG Prime List will get a RELATIVE STRENGTH (RS) focus tonight. Like we did during the last selloff, let’s keep track and build our RS list for when the market finds support and resumes higher.


These are NOT setups, they are STRONG stocks still showing constructive price action worth tracking.


🎖️ = Alex’s highest conviction setups
IMPORTANT NOTE:
I have the discipline to build a detailed FocusList each night, but I want to emphasize that I DON’T take all the trades that would trigger their entry. Some reasons to take a specific position over another or not take any trade, even if the alert is activated, are:
The general market price action
My Market-Based exposure model
My Portfolio-based exposure model (progressive exposure)
A high-conviction setup
Price action around the entry pivot
STOP LOSS:
Recent swing low pivot
For less active trading, you can use the recent swing low pivot as a good structure level to place your SL, but consider that the distance with the entry is more significant. You need to adjust your position size to keep the trade risk as a % of your portfolio, ideally below 0.5% or even 0.25% when the market conditions are not perfect.
LOD (Low Of Day) / HOD (High Of Day)
I like to use the LOD of the day I enter the trade. This way, I can use a larger position for the same trade risk as a % of my portfolio. BUT requires more active trade management and expects to be taken out more often (lower hit rate).
Then even if I take a trade at the entry pivot, I will very often sell it right away if the market roll over or the stock is backing out of the gate. I prefer to re-enter on the entry pivot reclaim than to be stuck with a larger loss. Please study all my education articles closely to learn how I handle trades around these entry pivots.
SECTORS PERFORMANCE
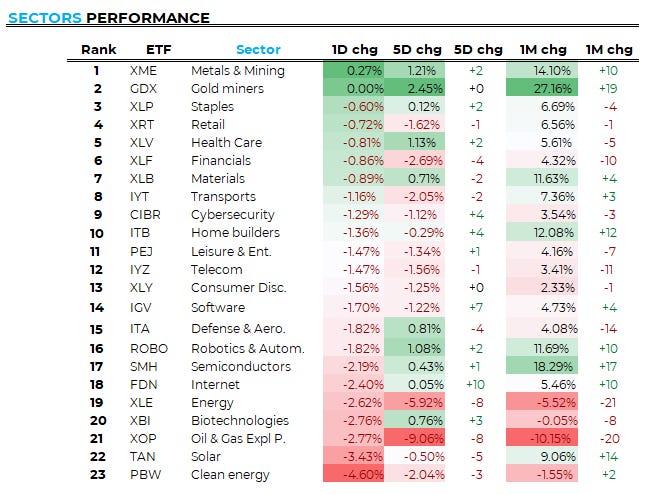
Leading sectors
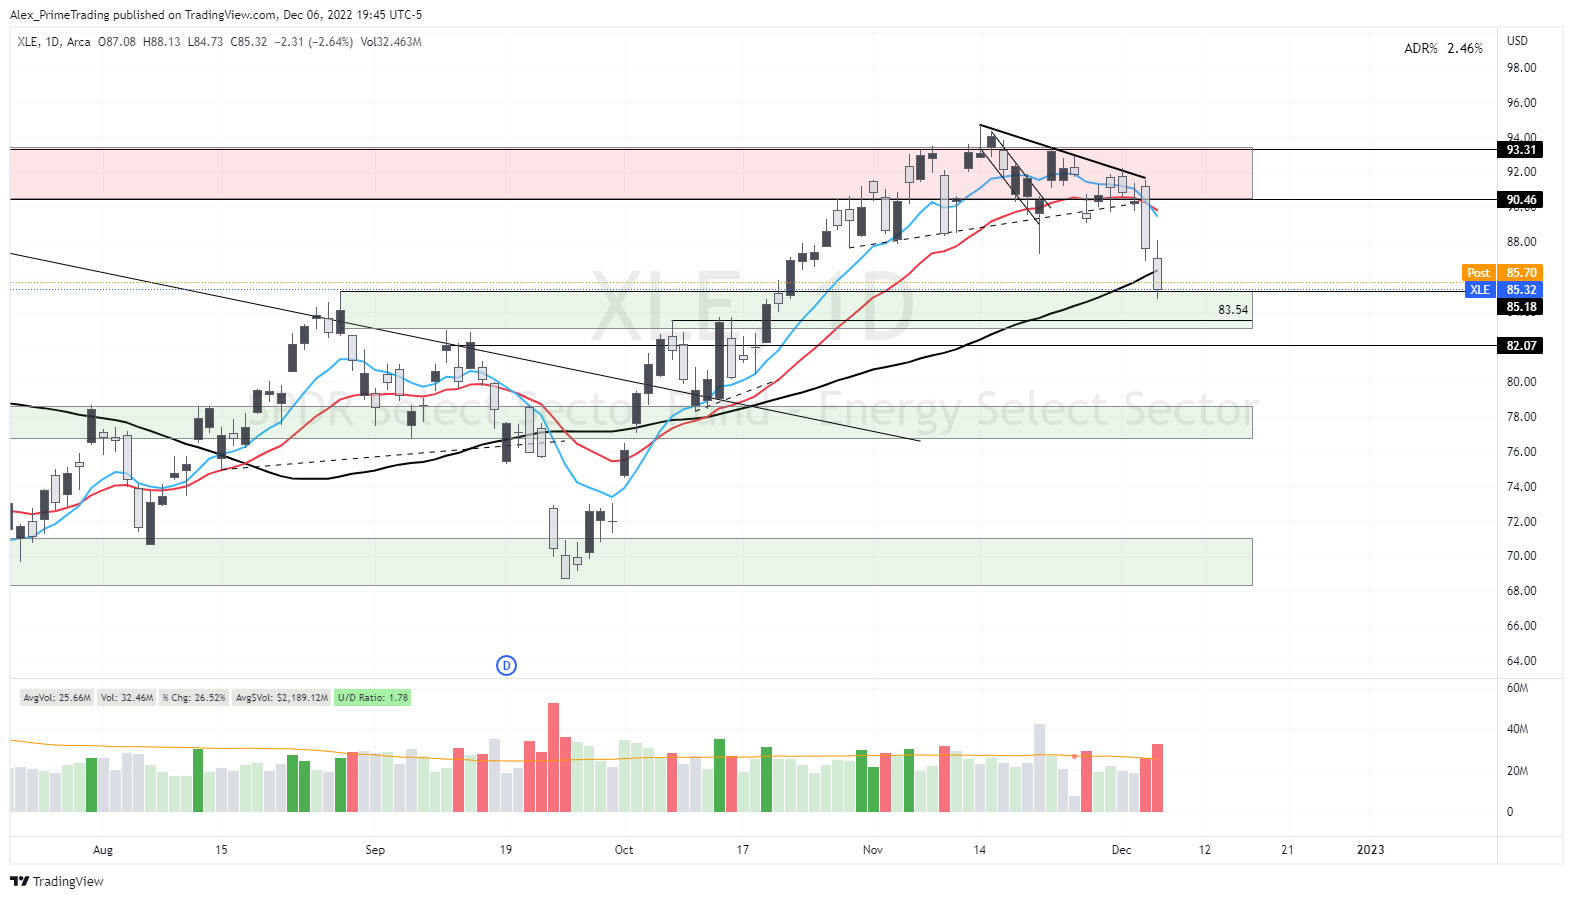
(XLE) Energy - Selloff continues, and we now undercut the 50dma and sit at the support area.
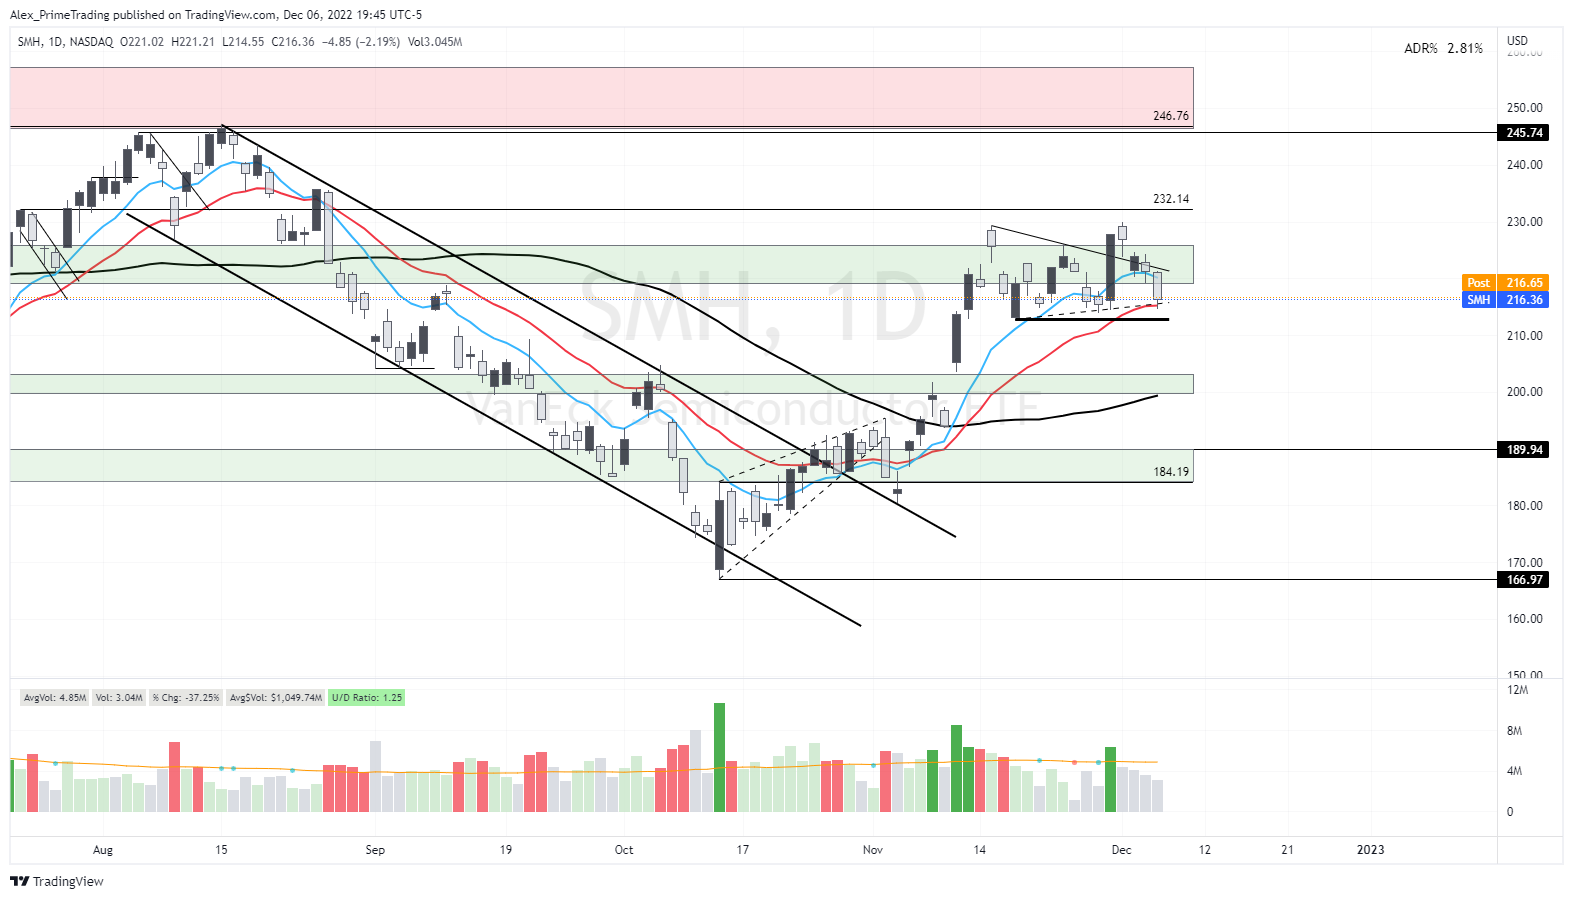
(SMH) Semiconductors - We were not able to hold the support area, but found some support at the 21dma.
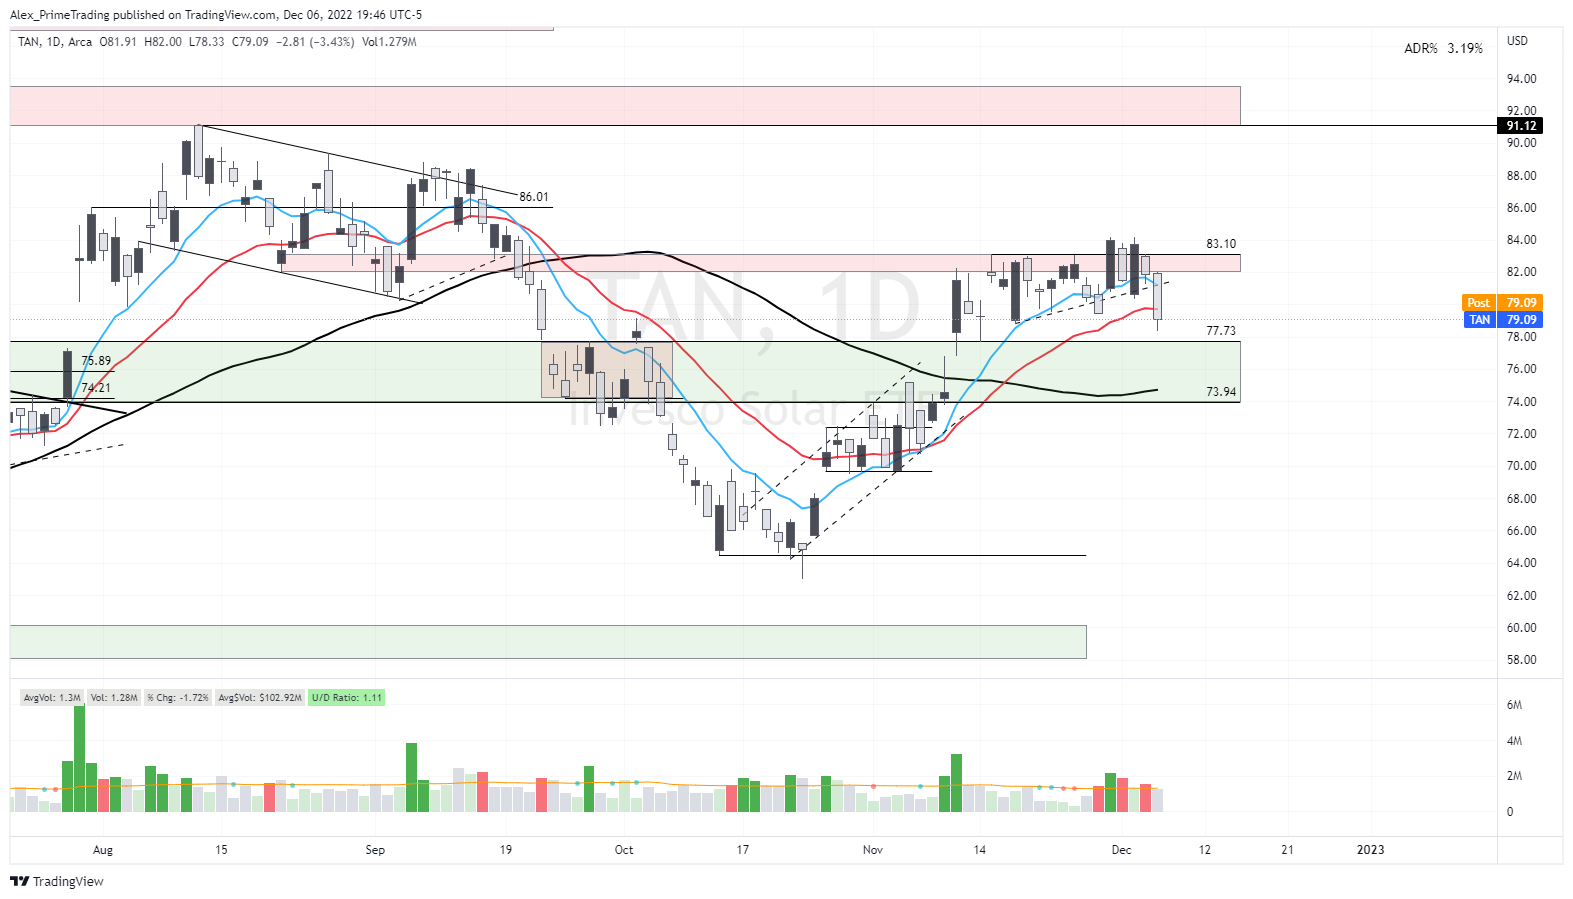
(TAN) Solar - We sliced through the 21dma & UTL…not good action. 77.73$ level is my next potential support.
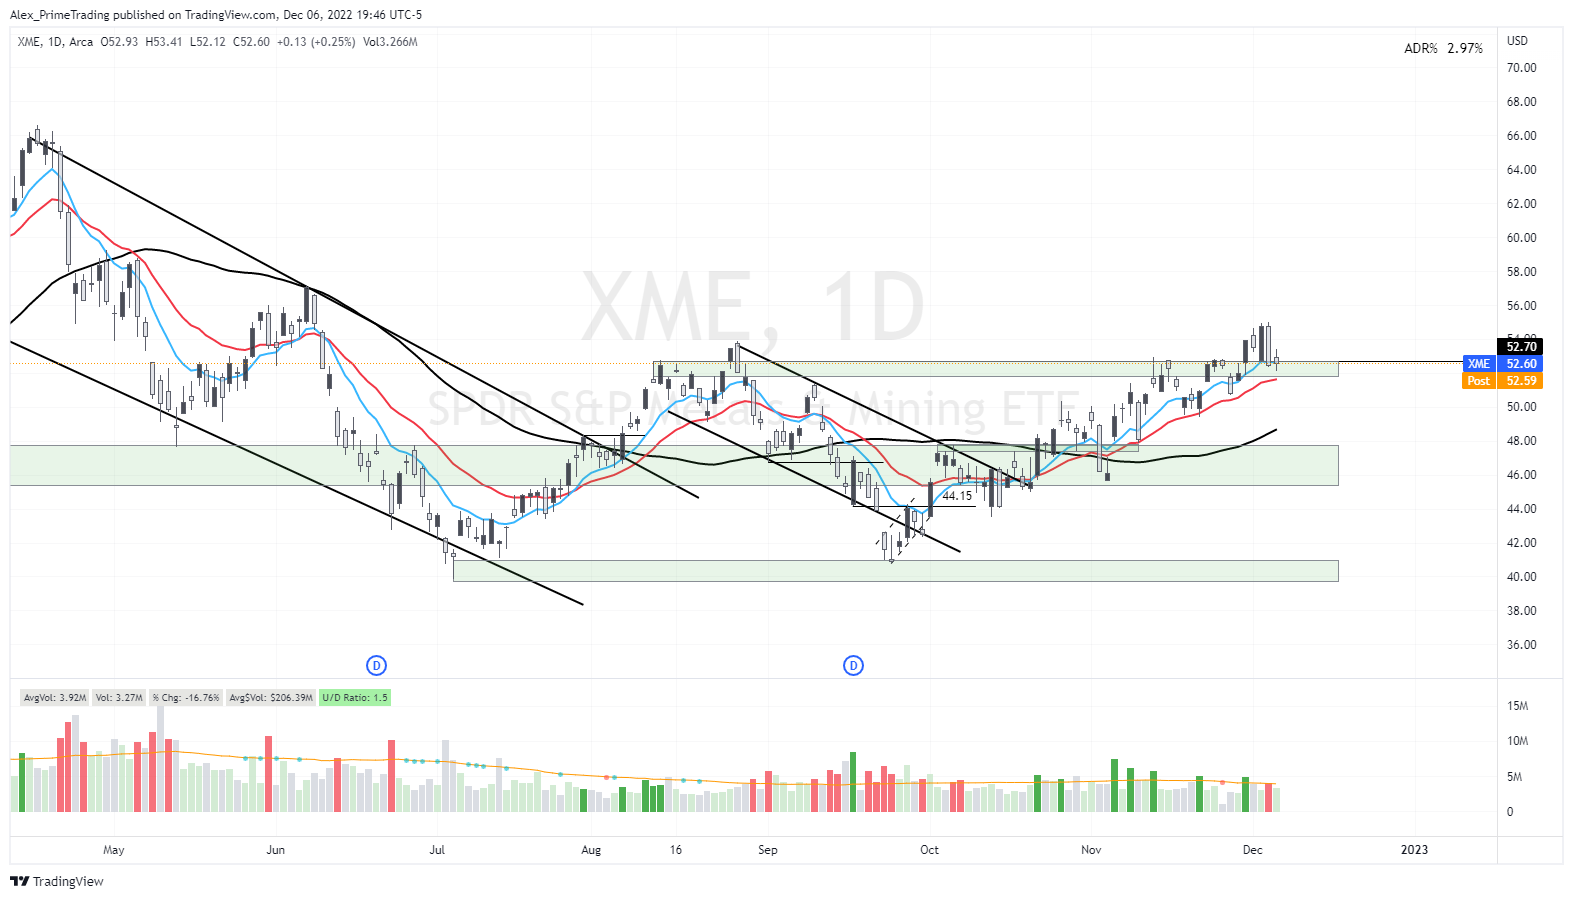
(XME) Metals & Mining - Strong action as we are still holding the stage 1 base area.
(ITA) Aerospace & Defense - Big reversal at the ATH base area….this is no bueno.

On watch:
(XBI) Biotech - A significant risk of rollover here IMO, and that’s the bet I took with LABD today. We are sitting right at the UTL of last month's rally wedge.

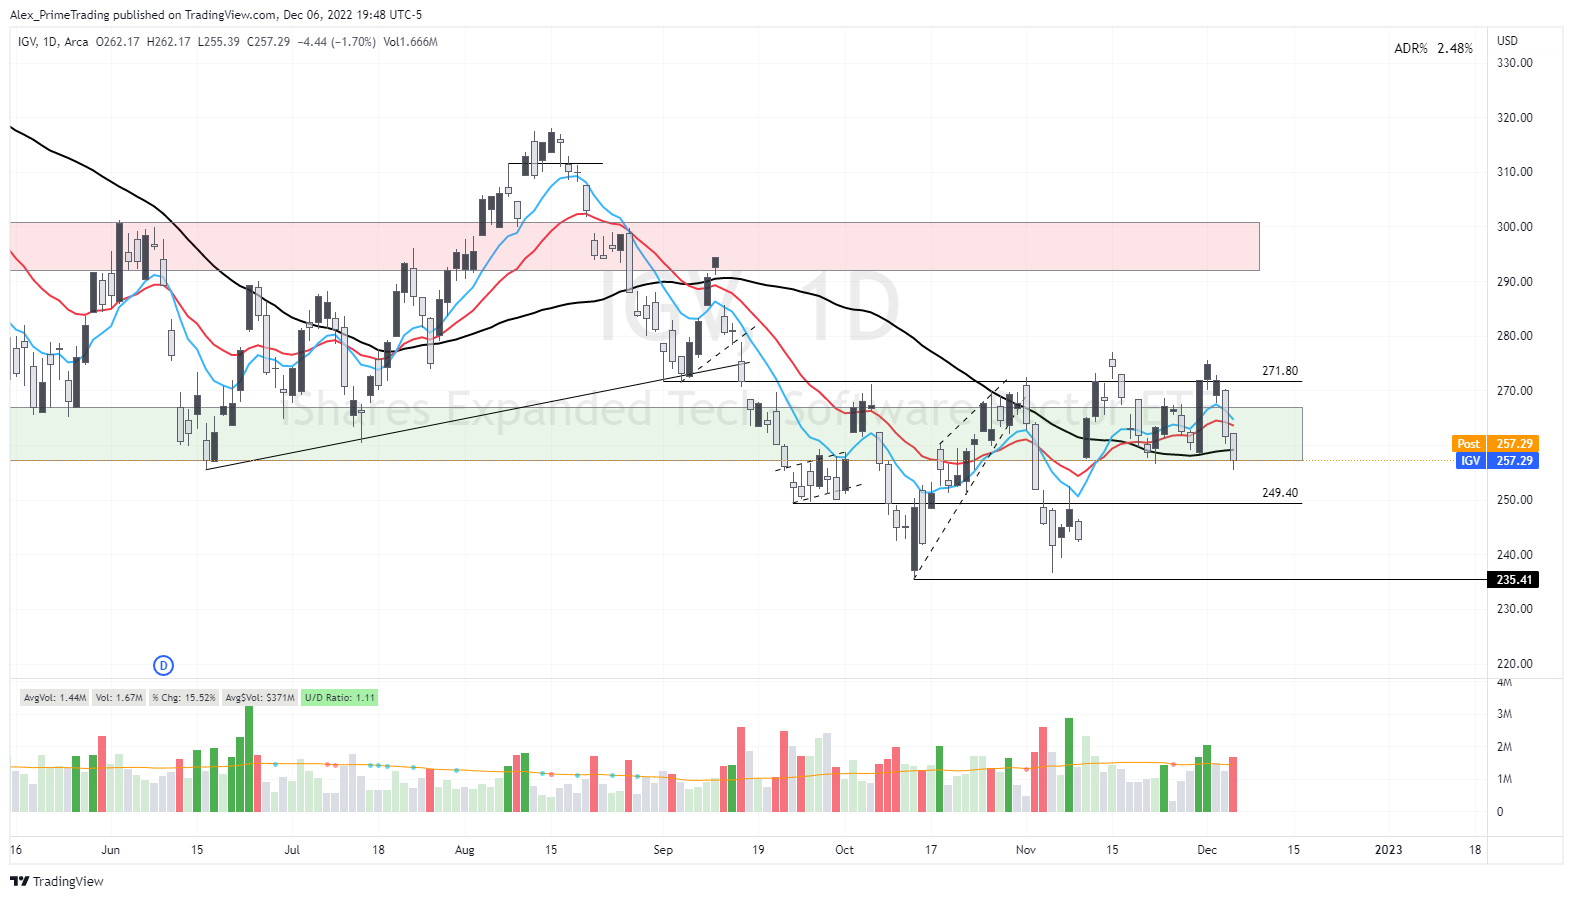
(IGV) Software - Followed through on yesterday’s reversal, and we closed below the 50dma. Not good.
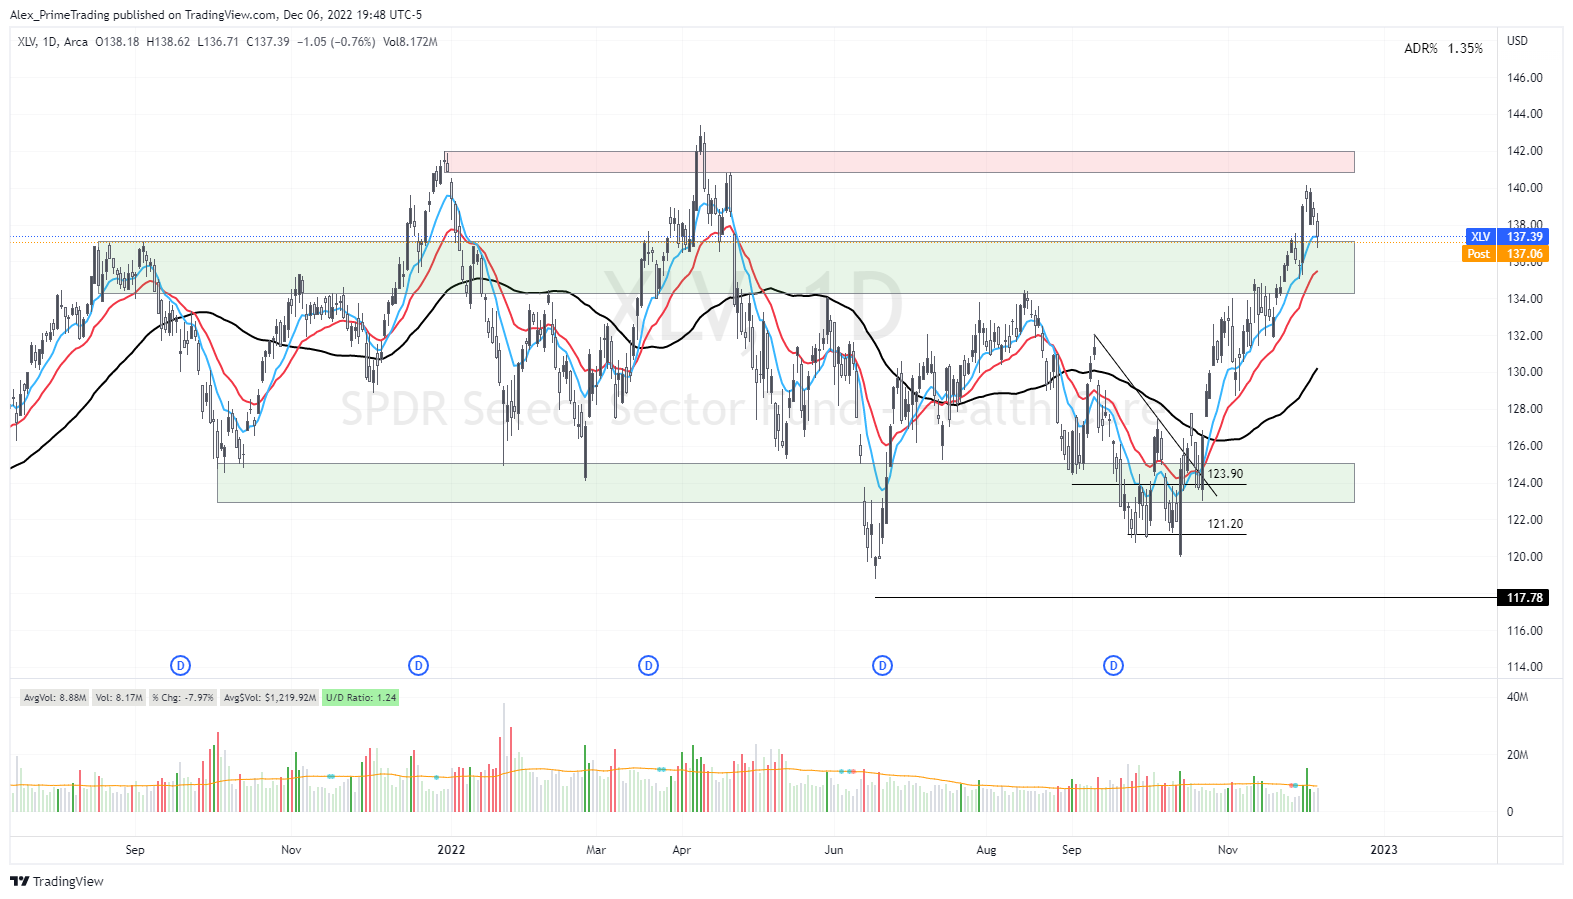
(XLV) Healthcare - Still acting good and was supported at the 10dma & support area today.
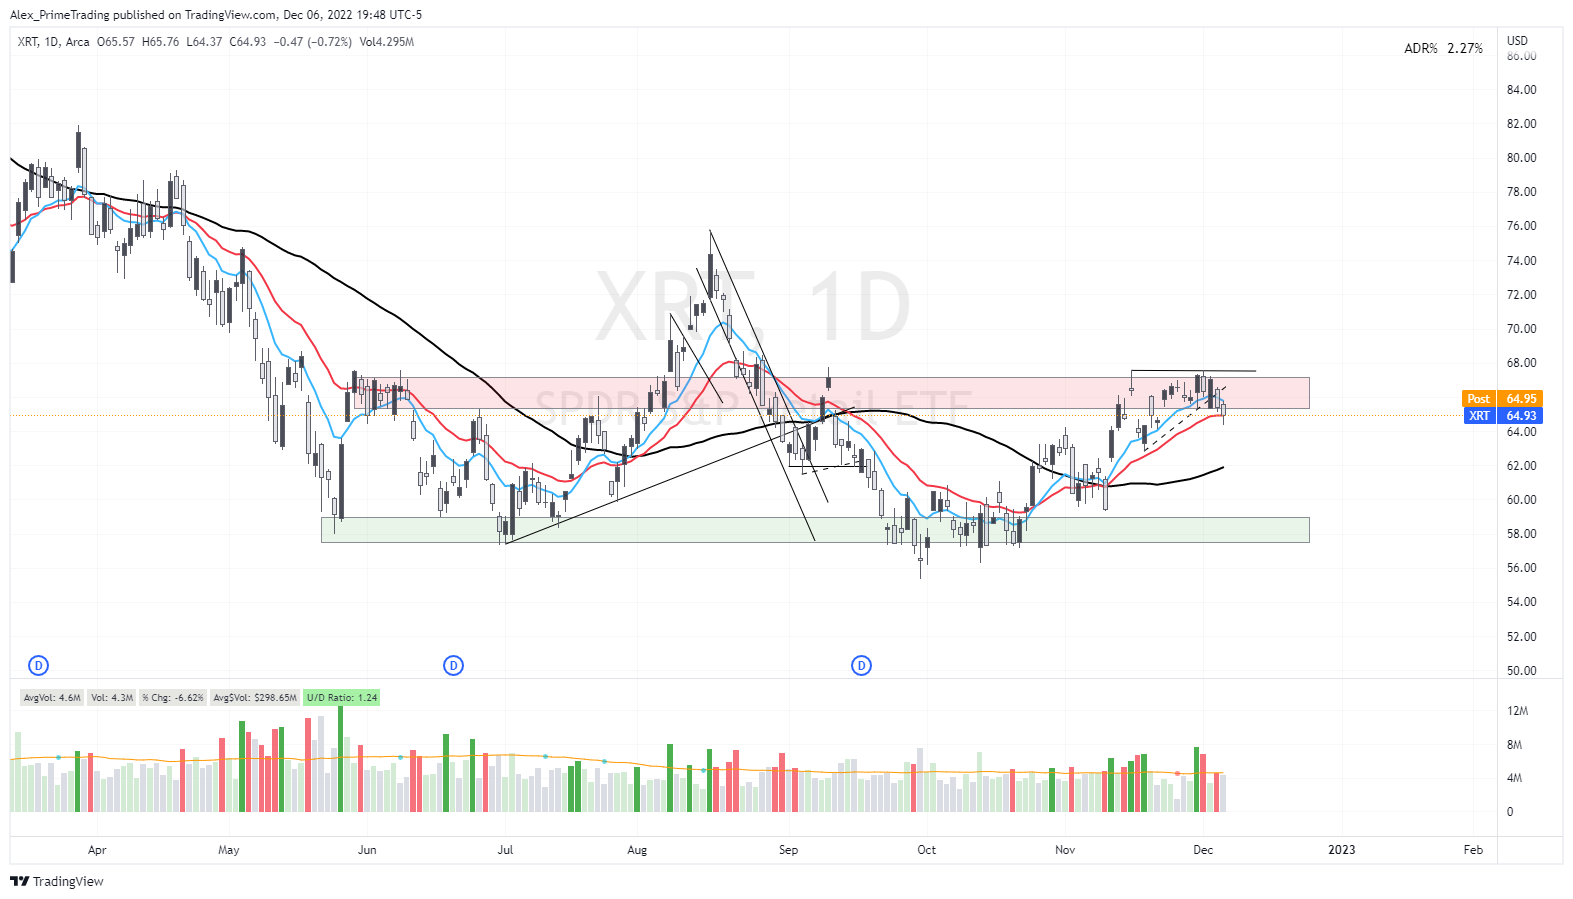
(XRT) Retail - Support at the 21dma
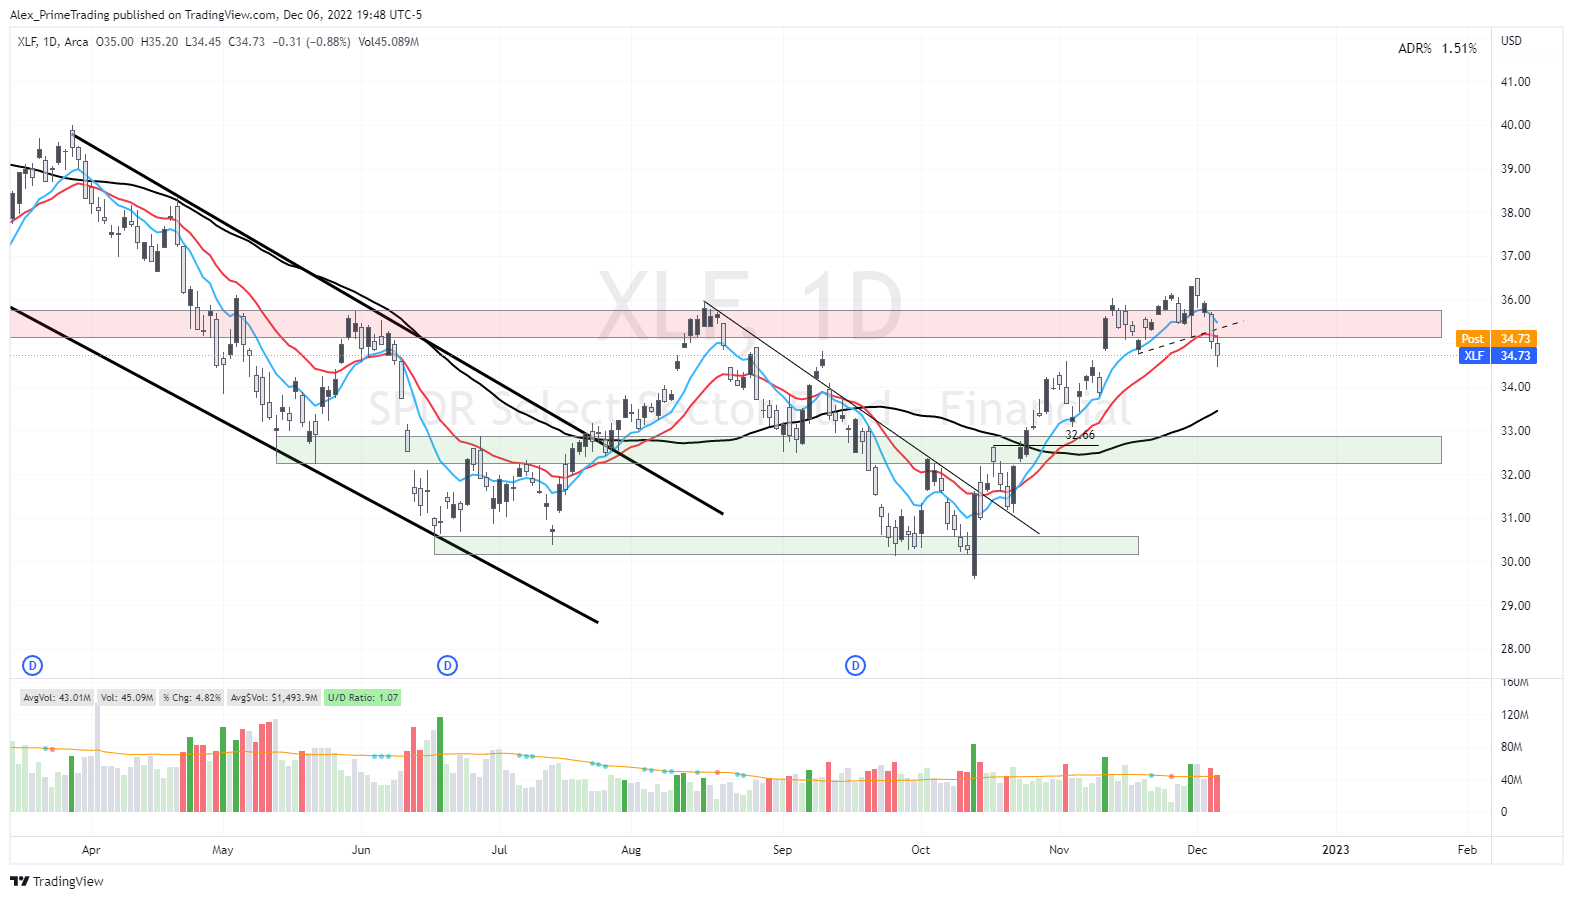
(XLF) Financial - Broke below the 21dma & UTL. At risk.
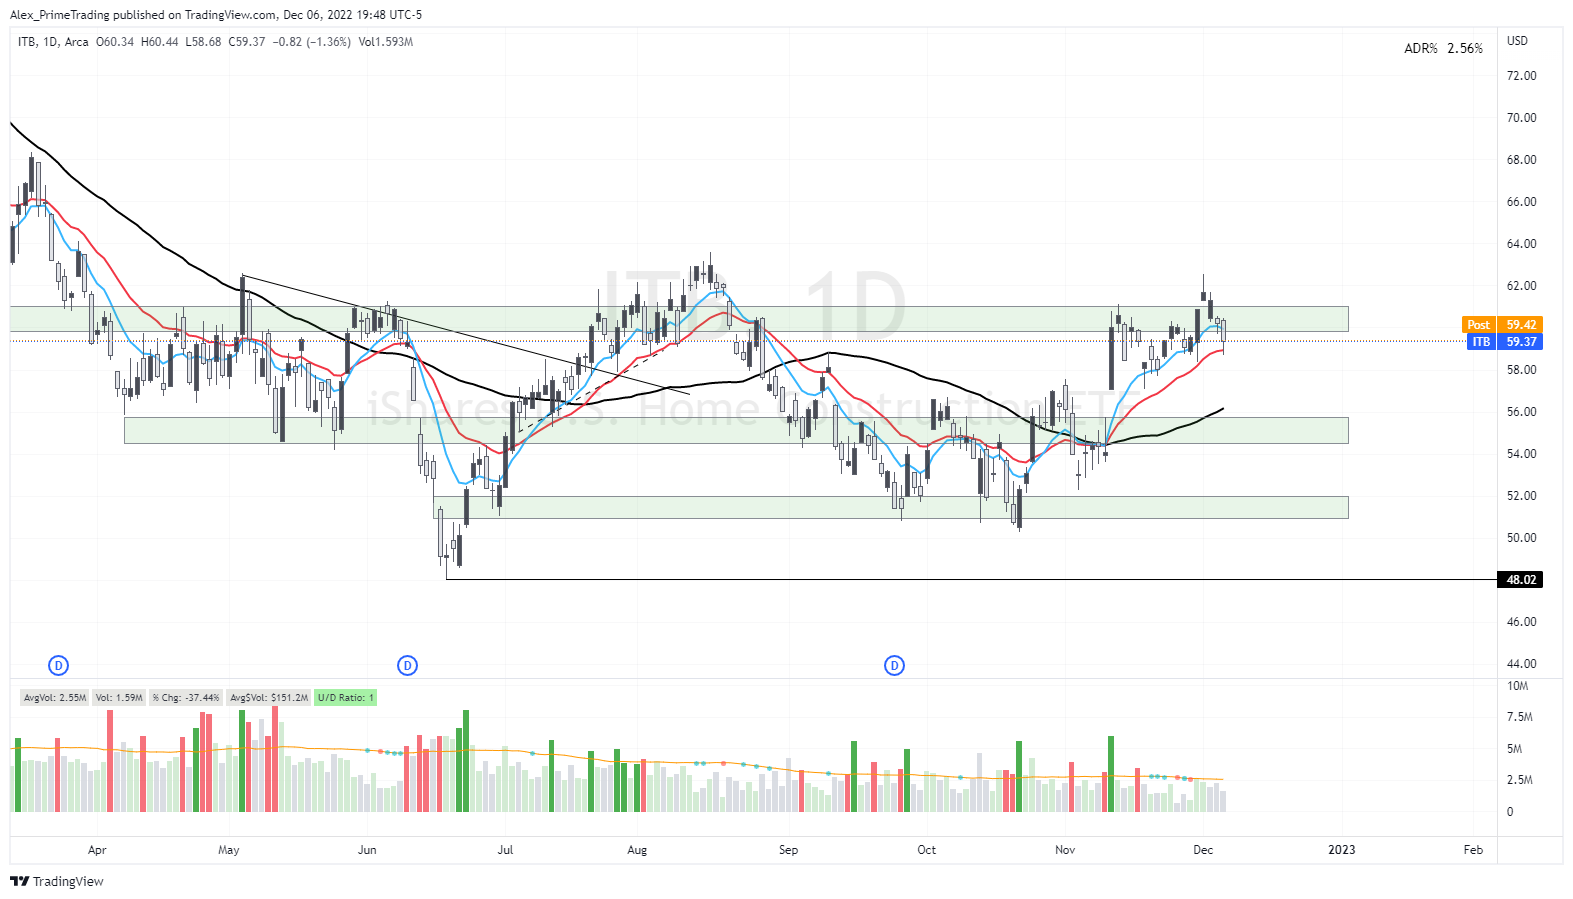
(ITB) Home Construction - Support at the 21dma still looks constructive.
MARKET BREADTH & INTERNALS (RISK MODEL)
Market health indicators (MT/LT):
One of the most common questions I get is, Alex…how do I know it’s time to get back in the market and hold my positions for more than two days. So I am working to find the best indicators to help us gauge the medium & long-term breadth of the market to get engaged more heavily and risk-on when the TIME IS RIGHT.
!MCSUMNYA (McClellan summation index & 10dma) - The first one is the McClellan summation index with a 10dma as a crossover signal. It gives a more early signal that we’ll time as the first sign of improvement, but caution is required until the second indicator also flashes his signal.
Learn more about the indicator here

$USHL (Cumulative new 52W Highs/Lows & 50dma) - The cumulative NET new highs/lows with a 50dma crossover signal is a slower indicator to gauge the longer-term trend of the market. In that case, we never got any signals in all of 2022, so it’s representative of the bear market and underlying weakness of this market and even the rallies we got.
Learn more about the indicator here

NYHL (New 52W Highs/Lows) - Acceleration on the downside.

NYAD (Net Adv/Decl) - A slight improvement, but still very negative.

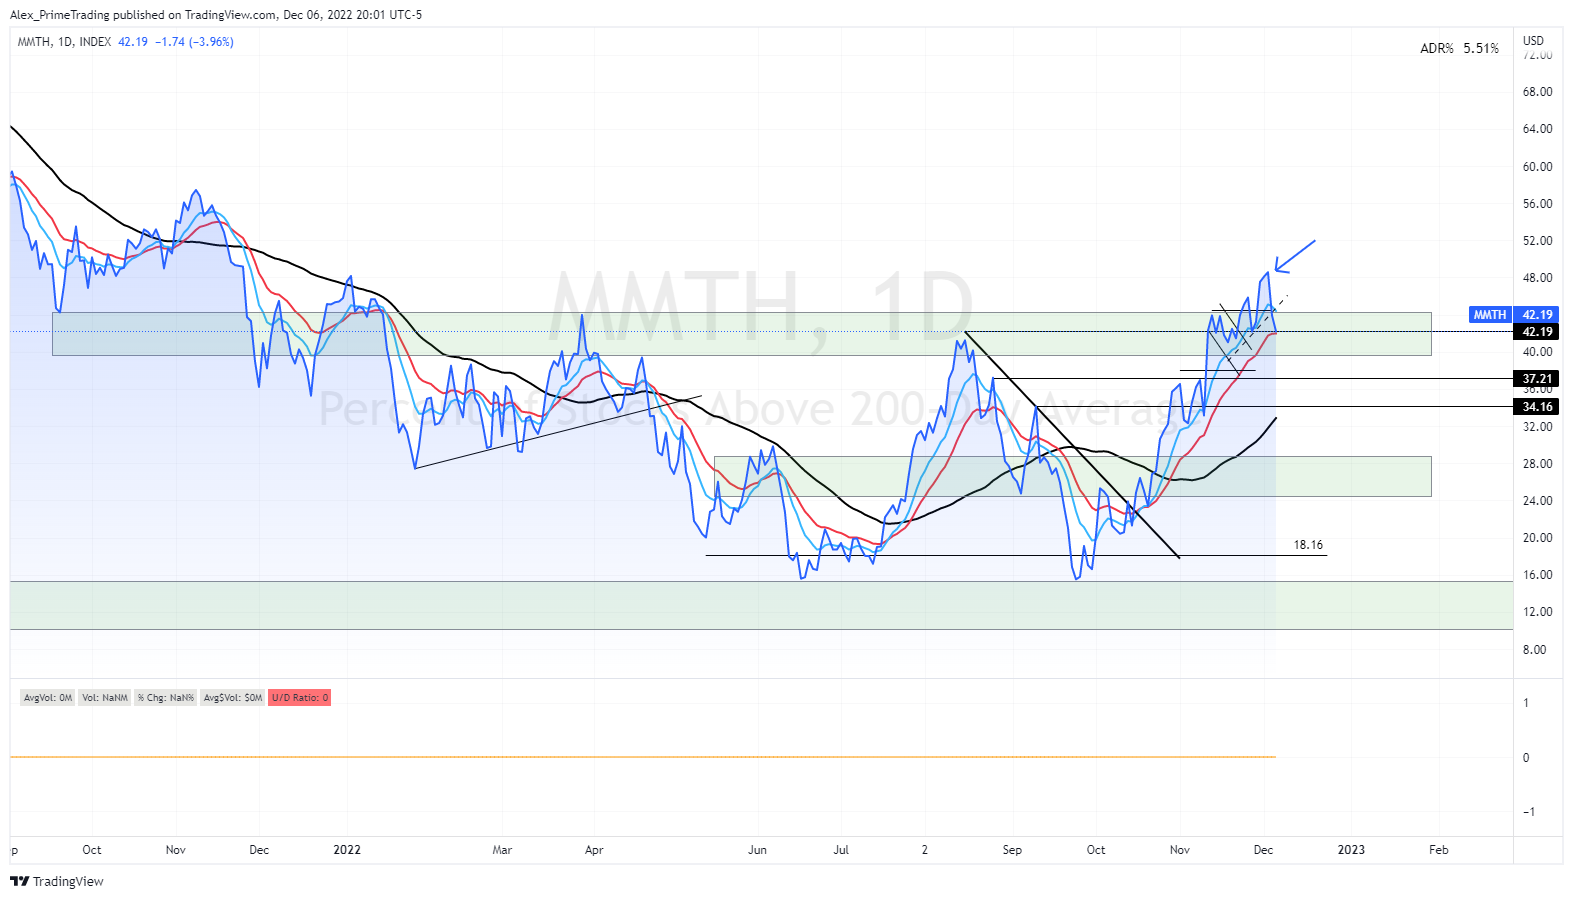
MMTH (Stocks > 200dma - LT breadth) - Followed through and now sitting in base area & 21dma. Pivotal.
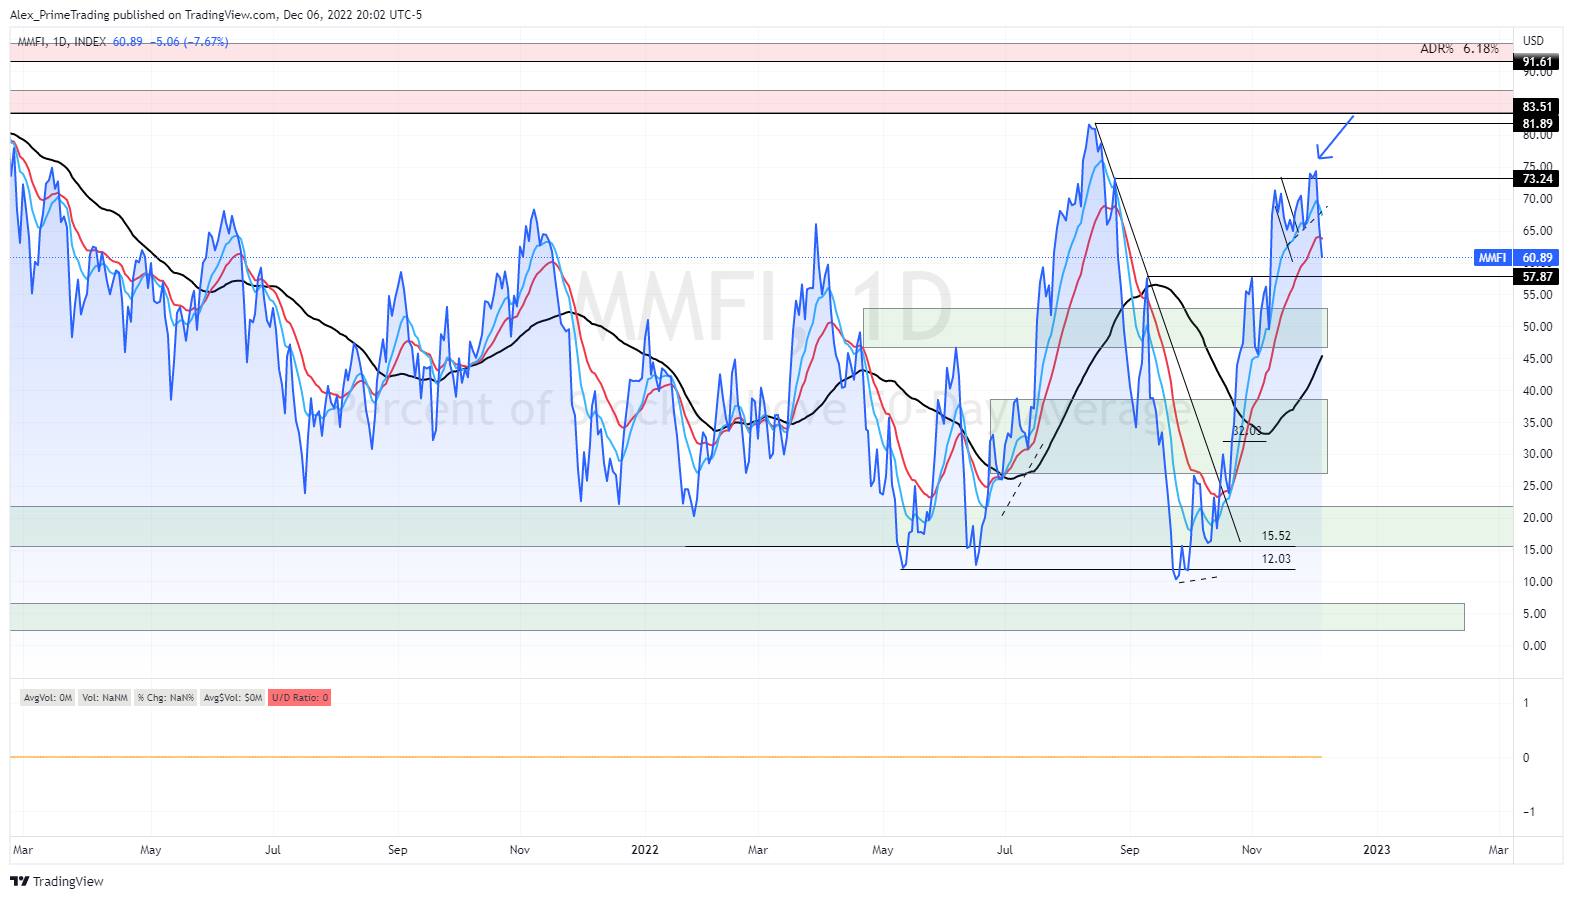
MMFI (Stocks > 50dma - MT breadth) - Break of 21dma
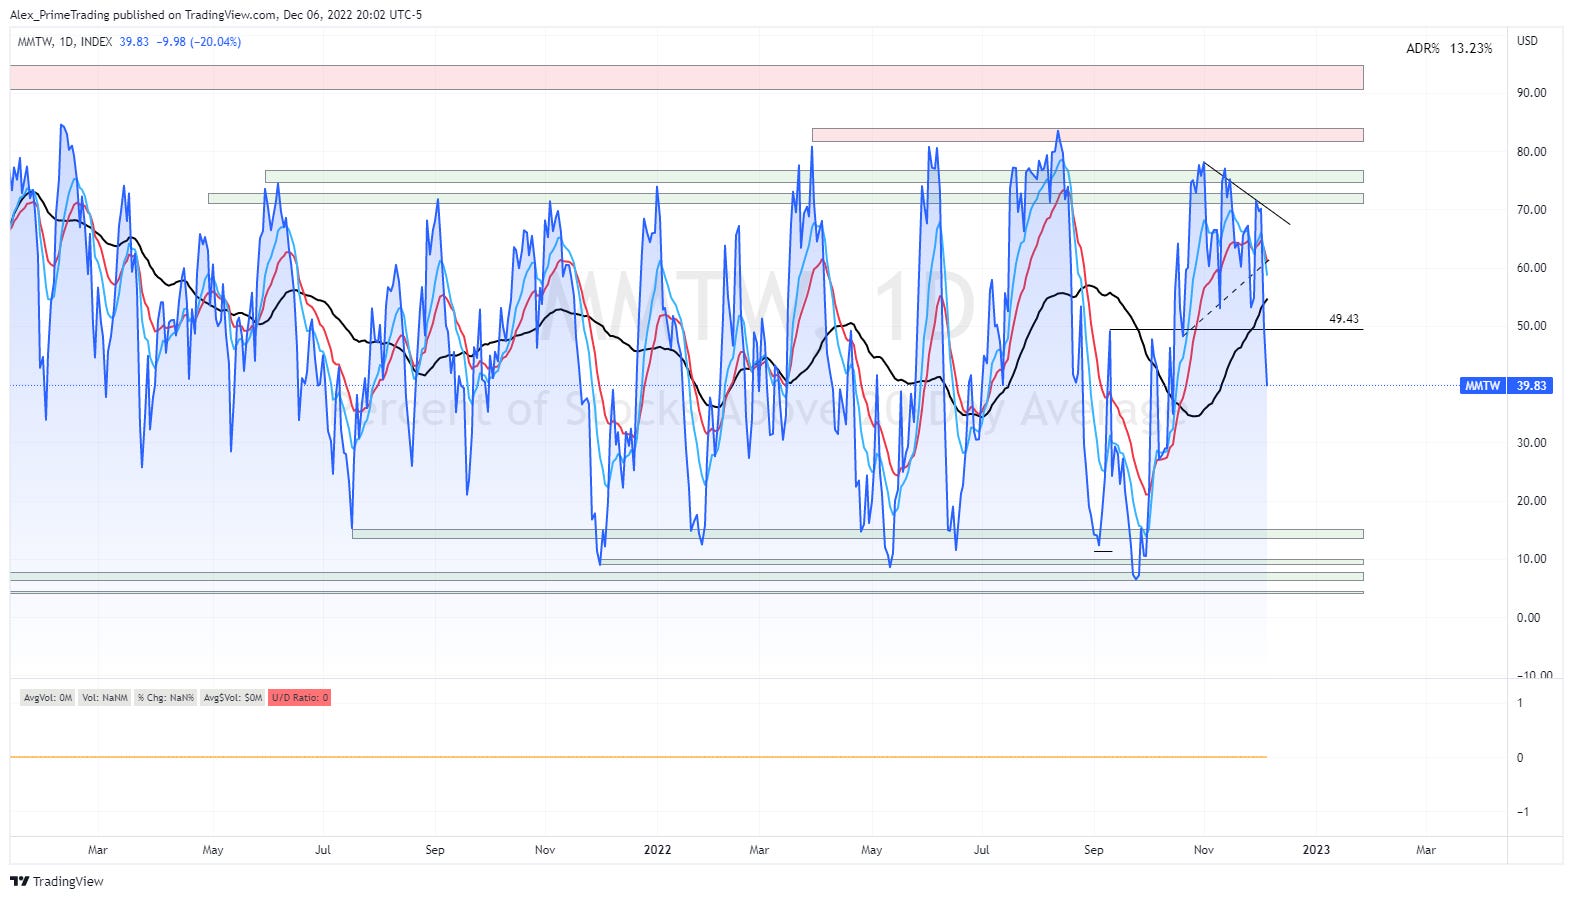
MMTW (Stocks > 20dma - ST breadth) - Big break here and close below the 50dma & 49$ pivot. This is not looking good.
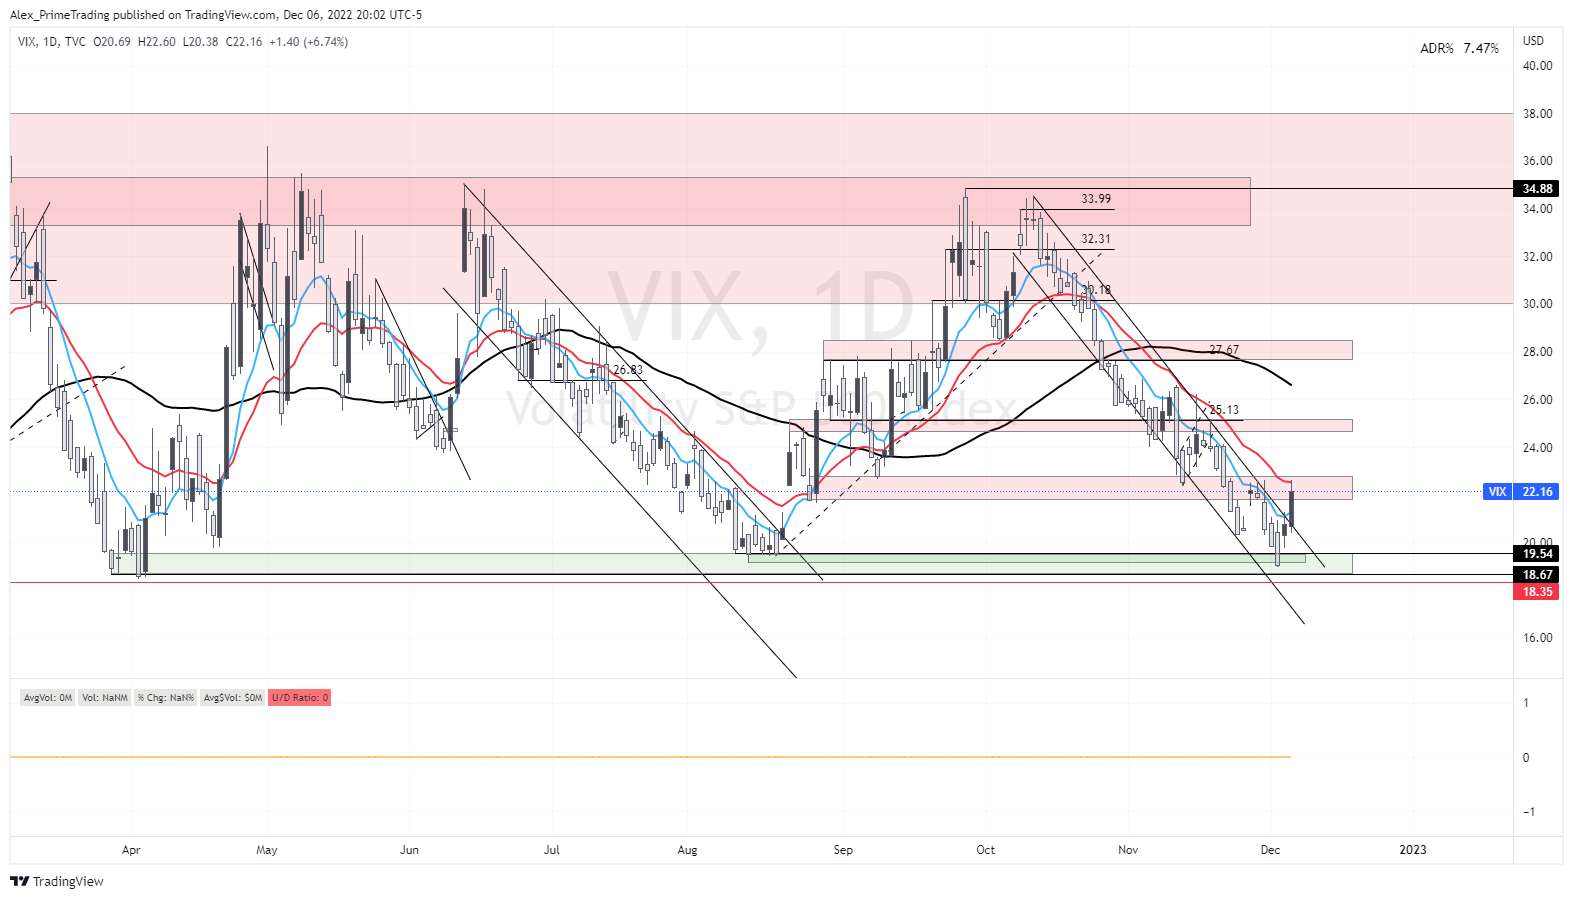
VIX (Volatility S&P 500) - We broke the current rally DTL and also closed above the 10dma. This was the scenario I didn’t want to see to confirm the rollover thesis. Now we are still right into the resistance area and 21dma…so we might reverse here as well. Pivotal.
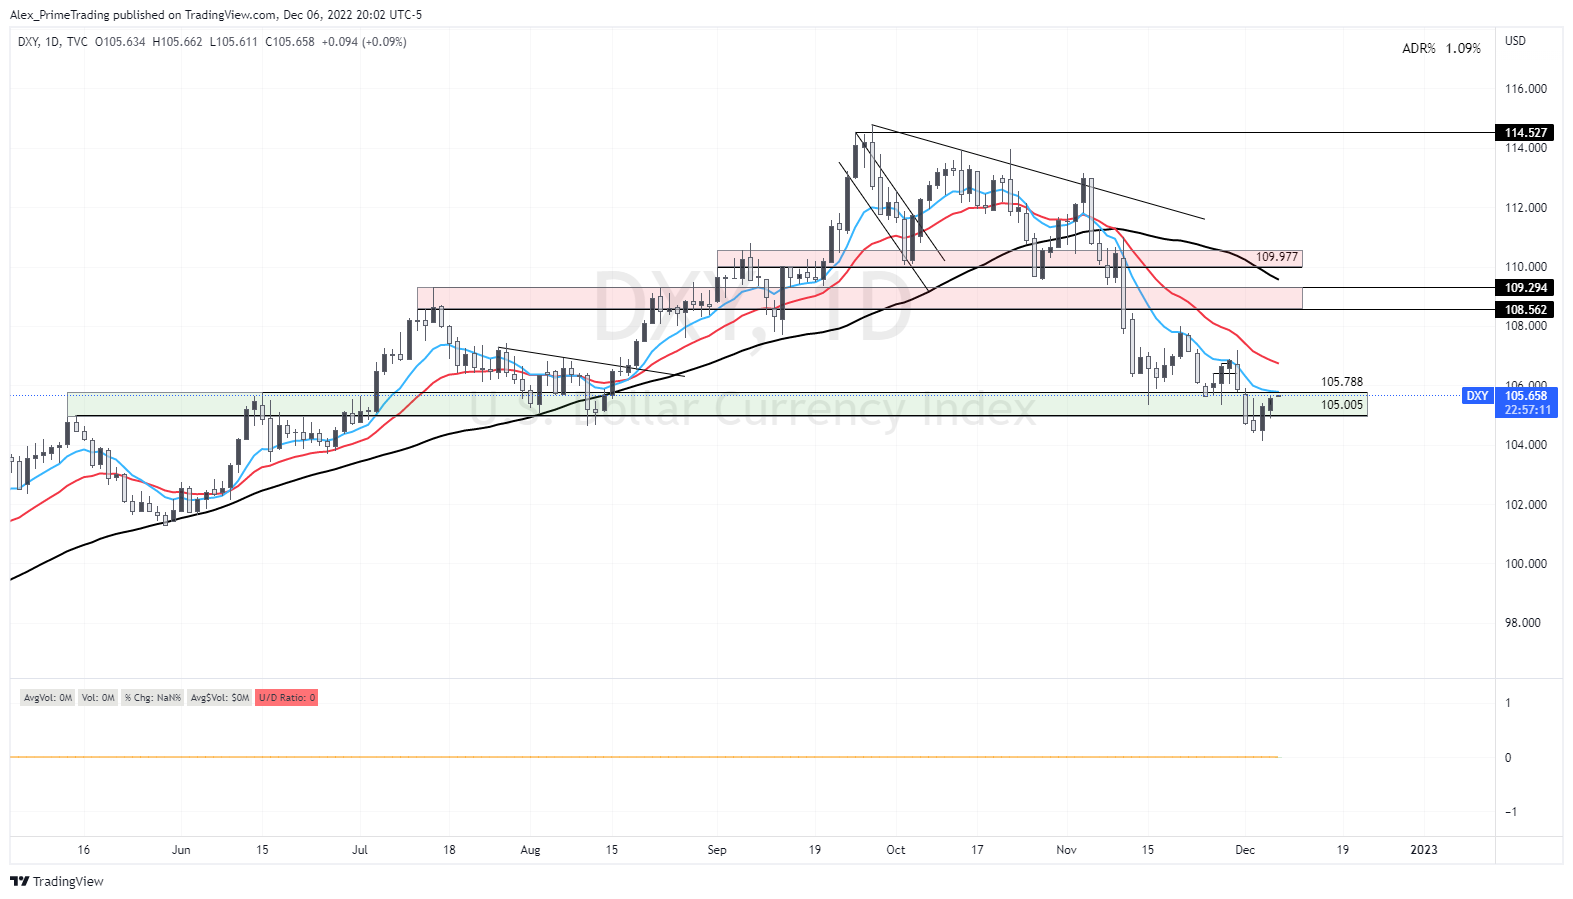
DXY (US $) - Closed above yesterday’s high, so followed through on 105$ reclaim, which is not a good news.
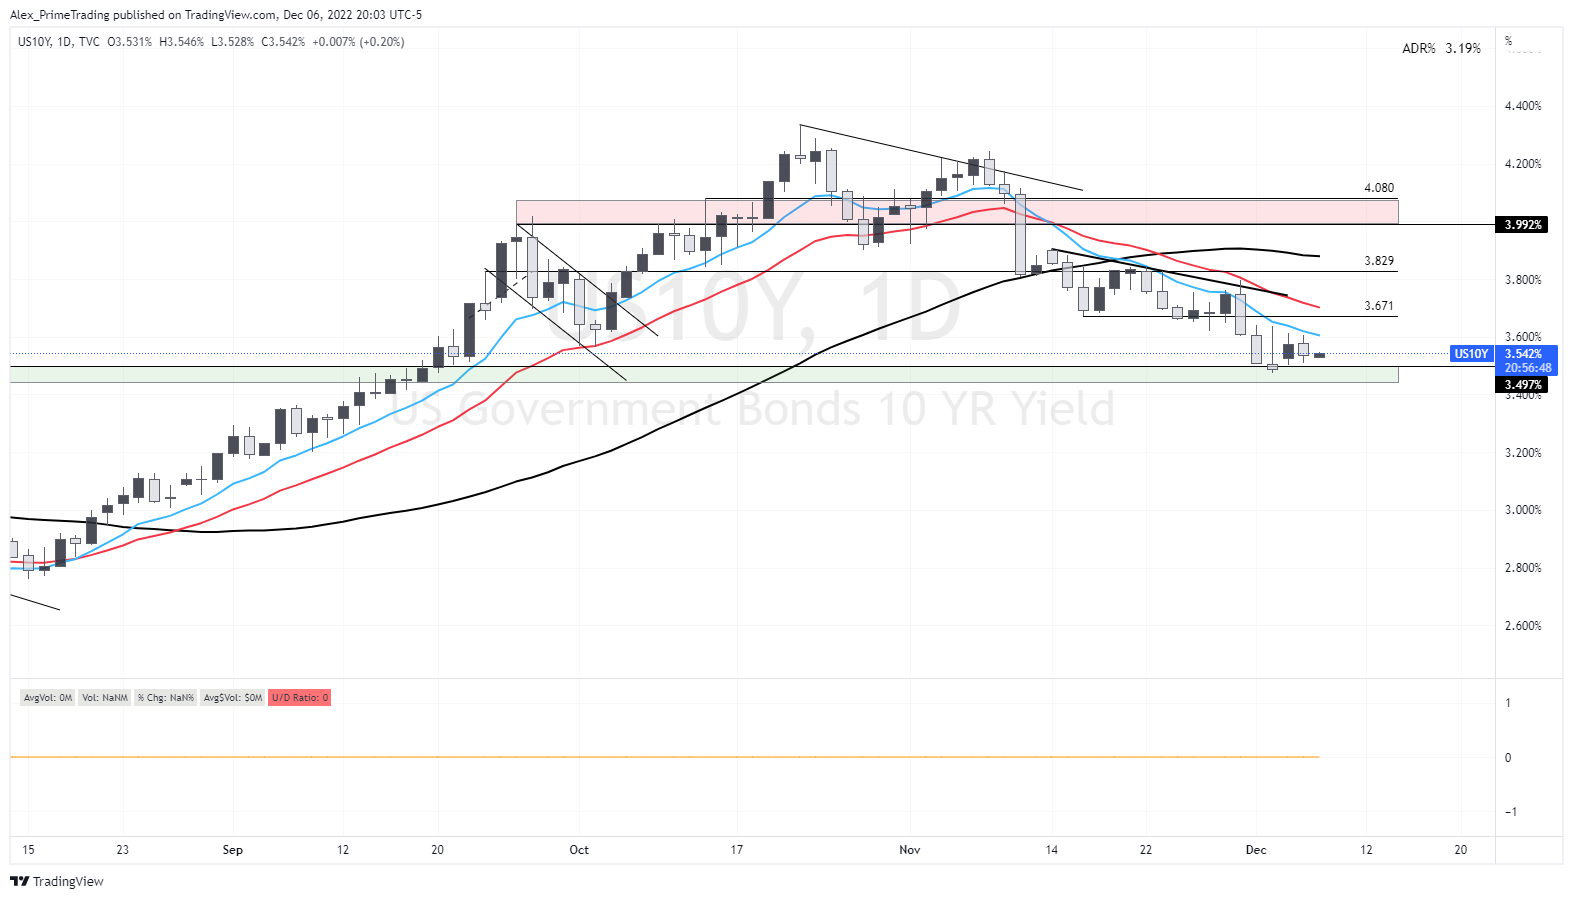
US10Y/TNX (US 10Y bond yield) - Second inside day. Which way we’ll break?
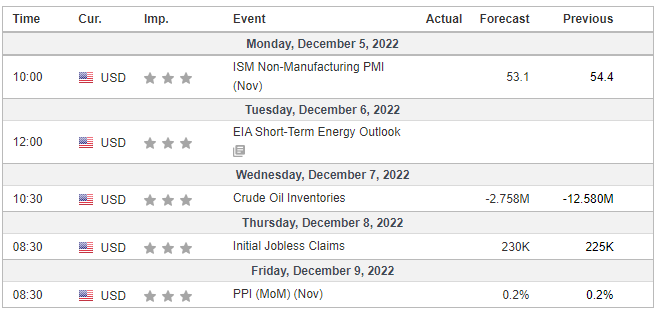
ECONOMIC & EARNINGS CALENDAR


PRIME MODEL SPREADSHEET (PT_database)

Access to the PT_database 👇
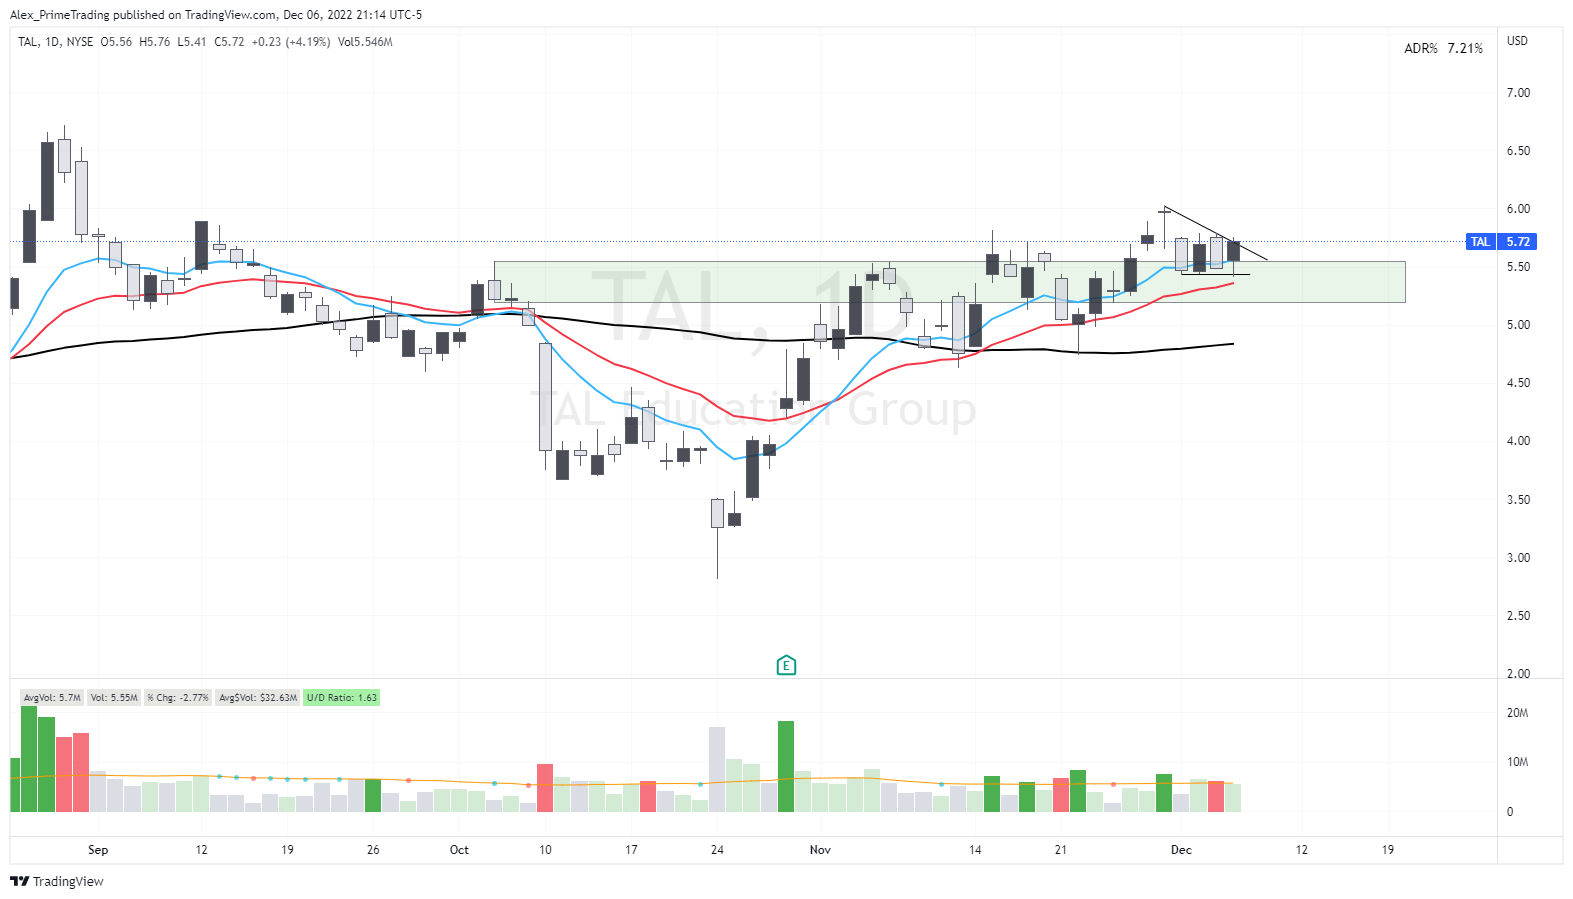
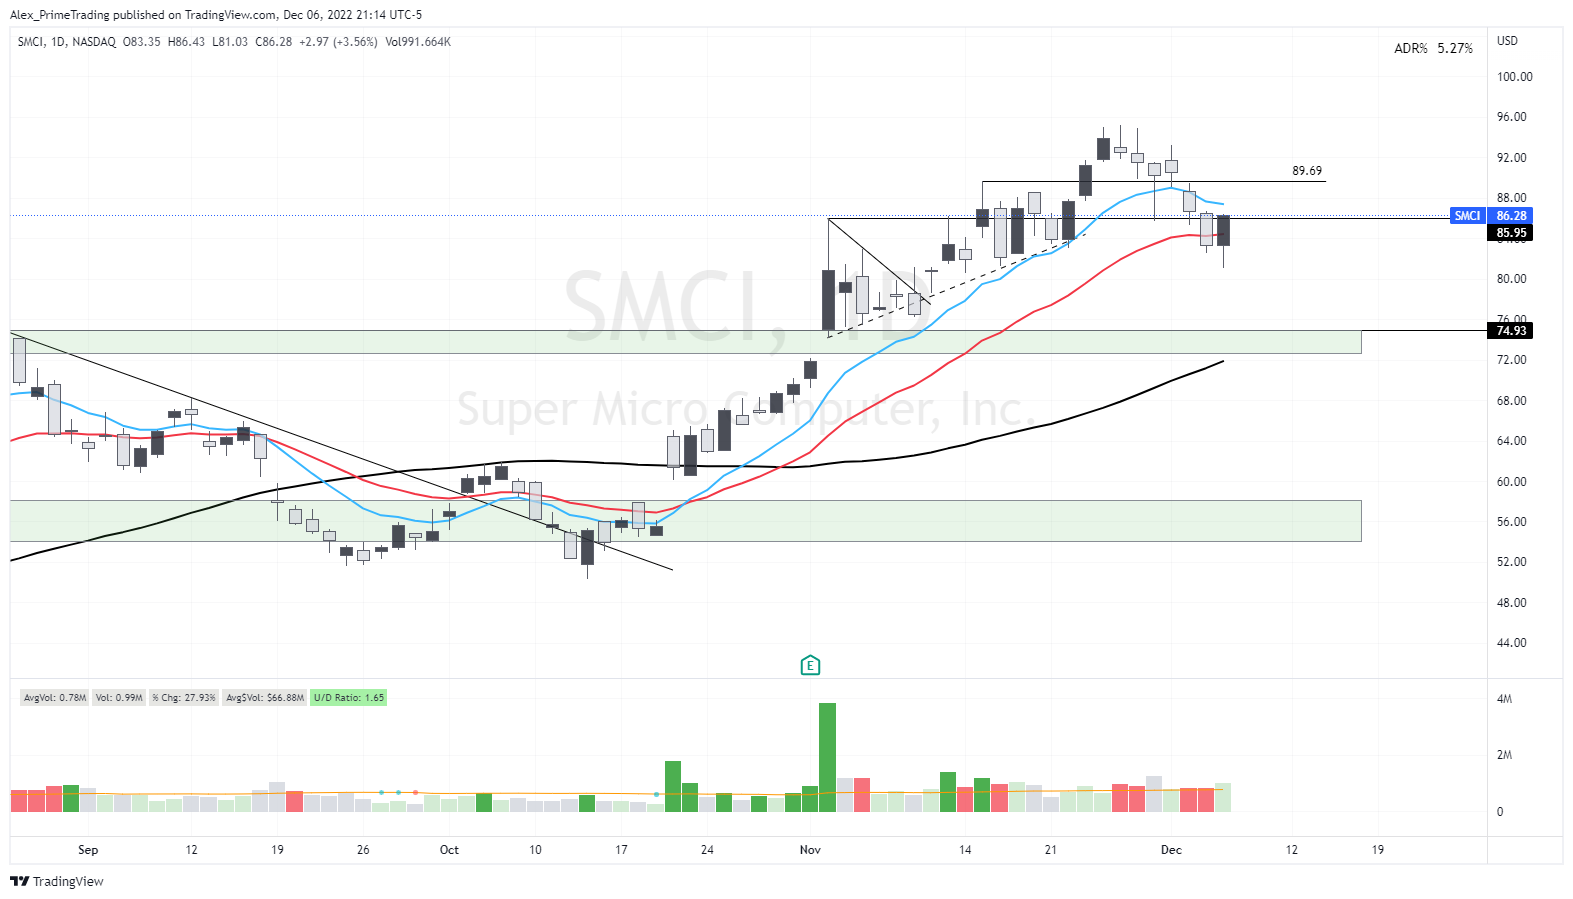
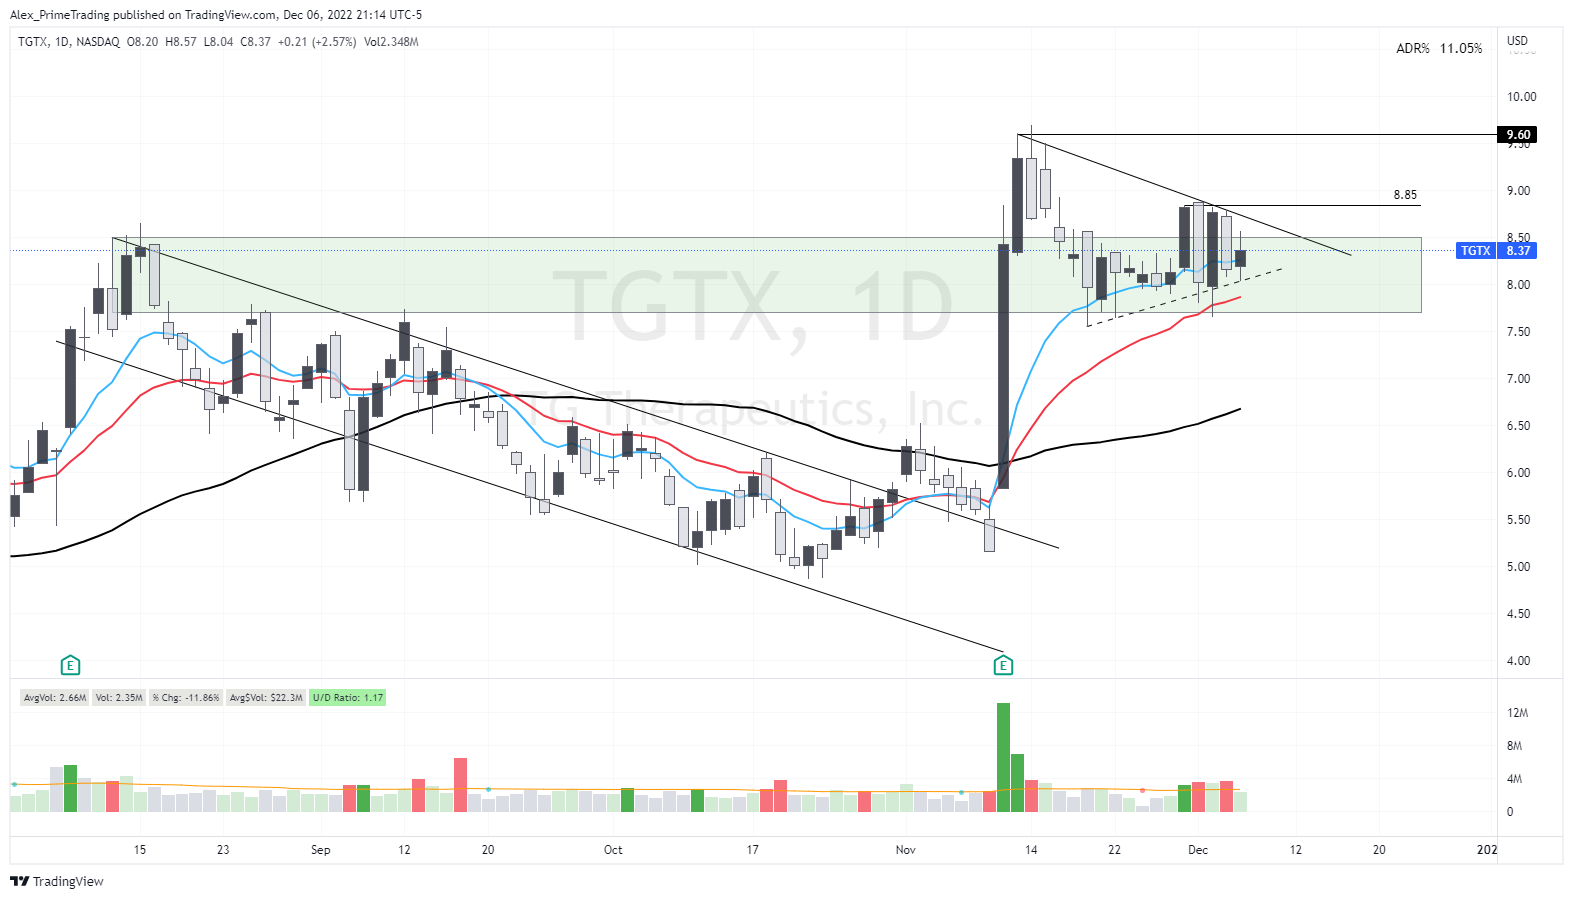
LEADERS LIST
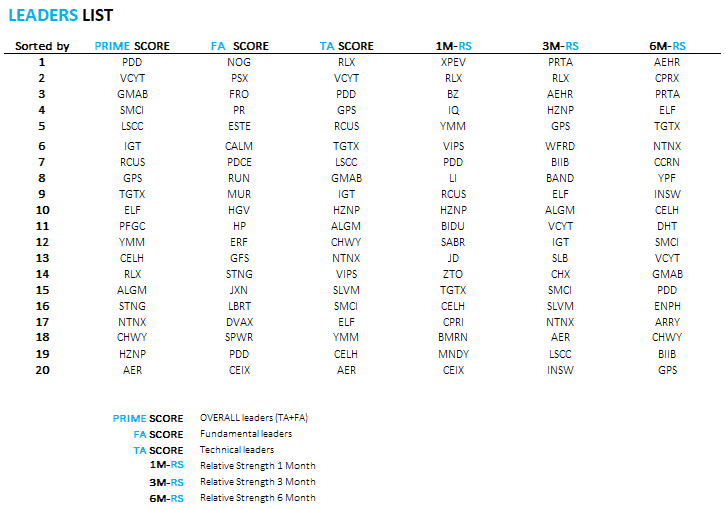
Overall leaders (PRIME Score)
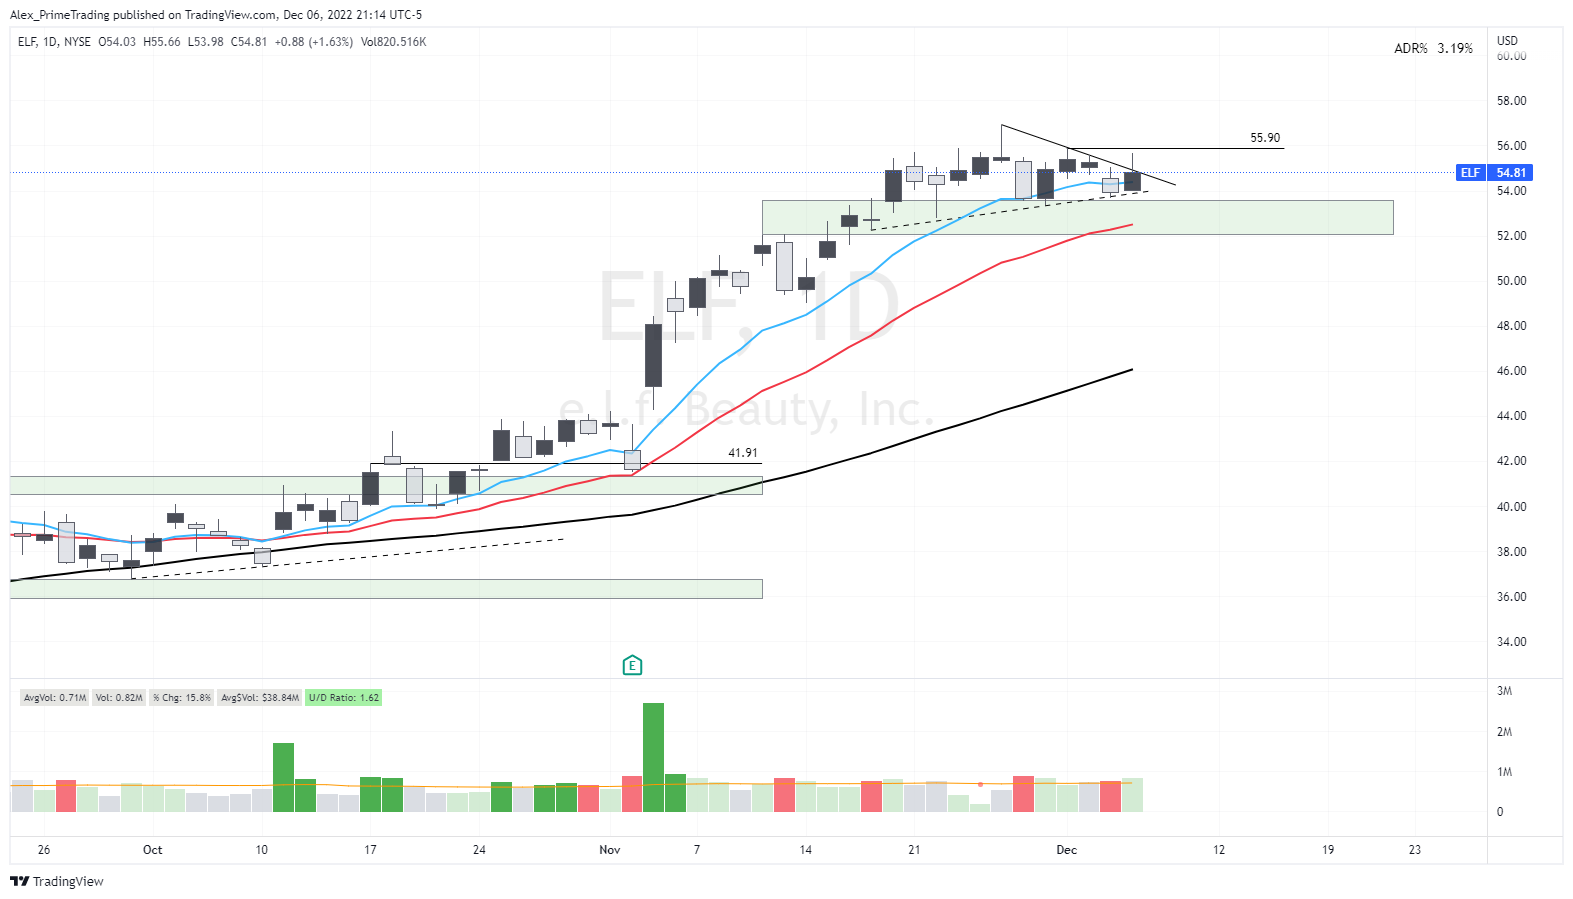
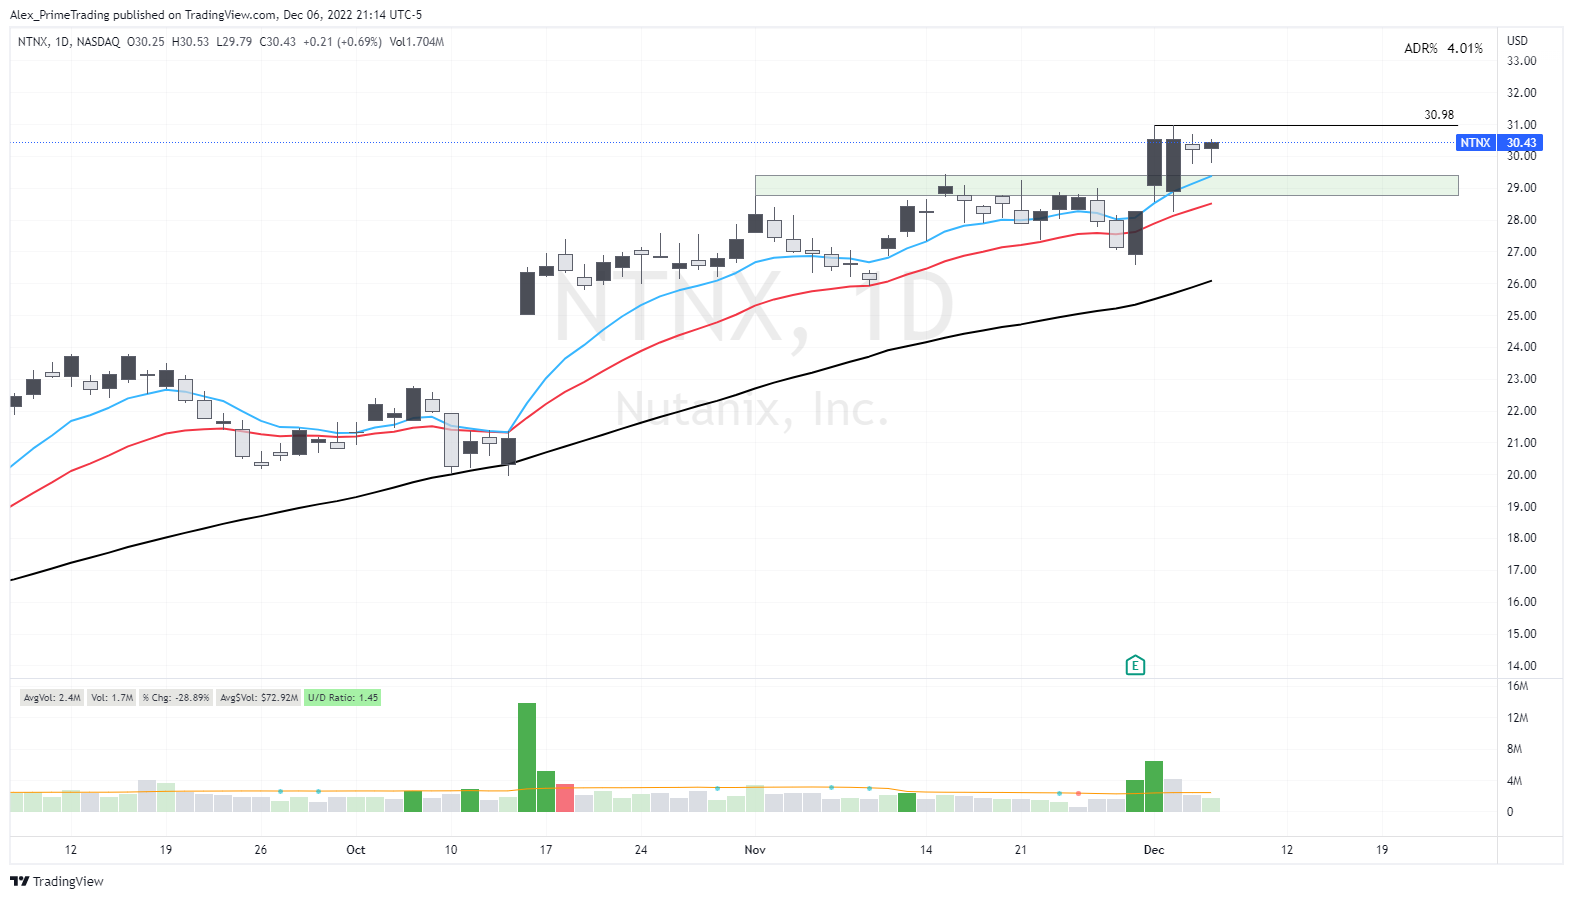
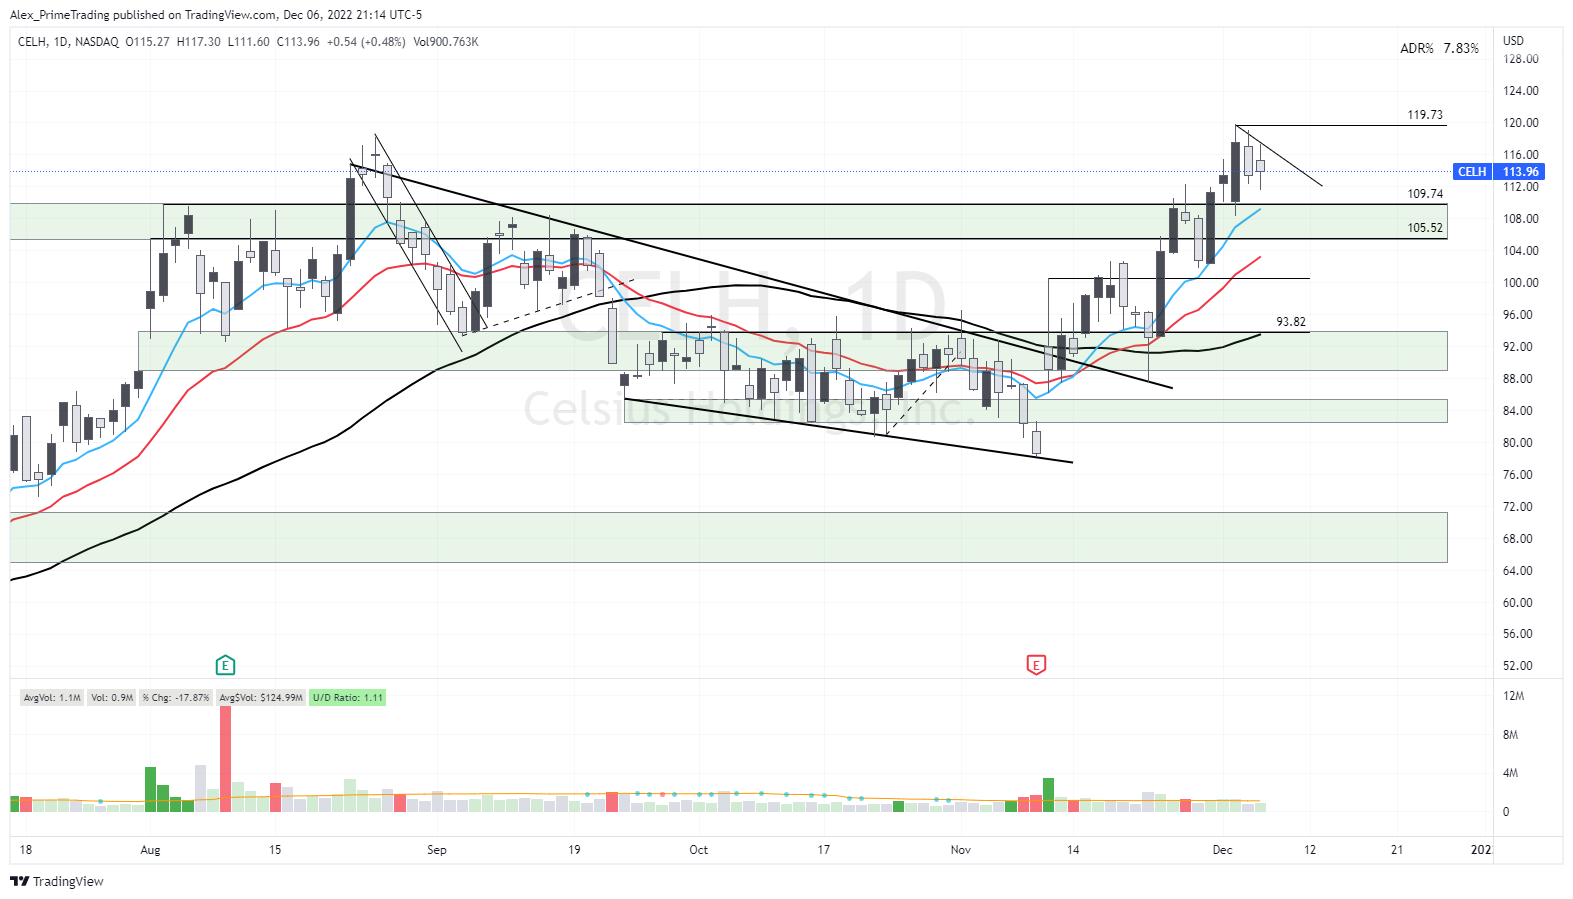
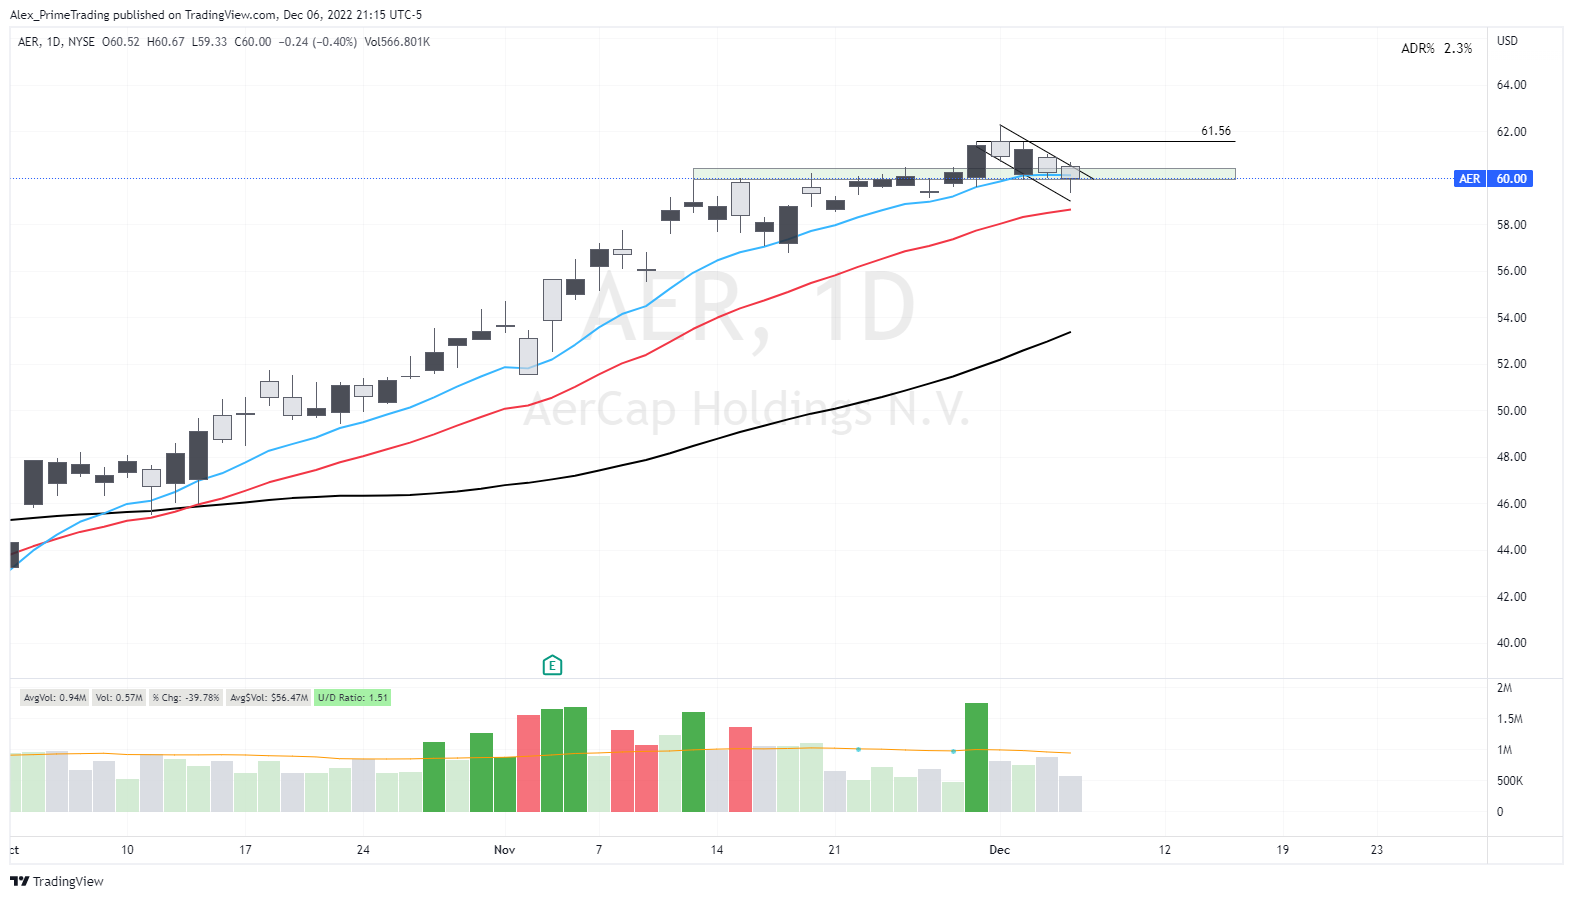
PDD,VCYT,GMAB,SMCI,LSCC,IGT,RCUS,GPS,TGTX,ELF,PFGC,YMM,CELH,RLX,ALGM,STNG,NTNX,CHWY,HZNP,AER,
Fundamental leaders (FA Score)
NOG,PSX,FRO,PR,ESTE,CALM,PDCE,RUN,MUR,HGV,HP,ERF,GFS,STNG,JXN,LBRT,DVAX,SPWR,PDD,CEIX,
Technical leaders (TA Score)
RLX,VCYT,PDD,GPS,RCUS,TGTX,LSCC,GMAB,IGT,HZNP,ALGM,CHWY,NTNX,VIPS,SLVM,SMCI,ELF,YMM,CELH,AER,
Relative Strength 1 Month (1M-RS)
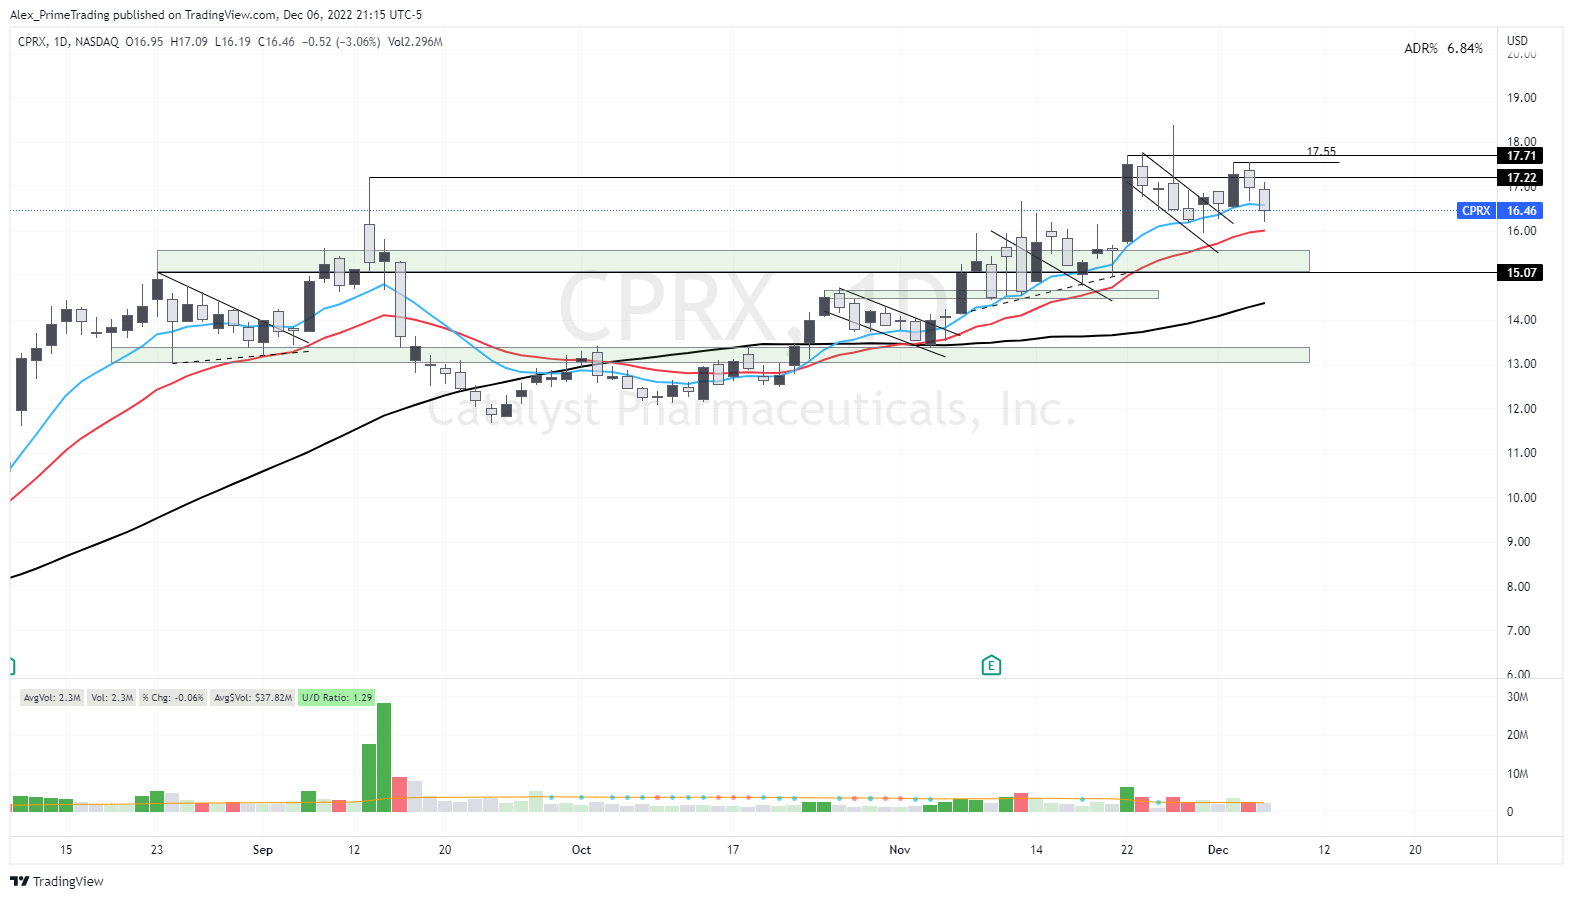
XPEV,RLX,BZ,IQ,YMM,VIPS,PDD,LI,RCUS,HZNP,BIDU,SABR,JD,ZTO,TGTX,CELH,CPRI,BMRN,MNDY,CEIX,
Relative Strength 3 Month (3M-RS)
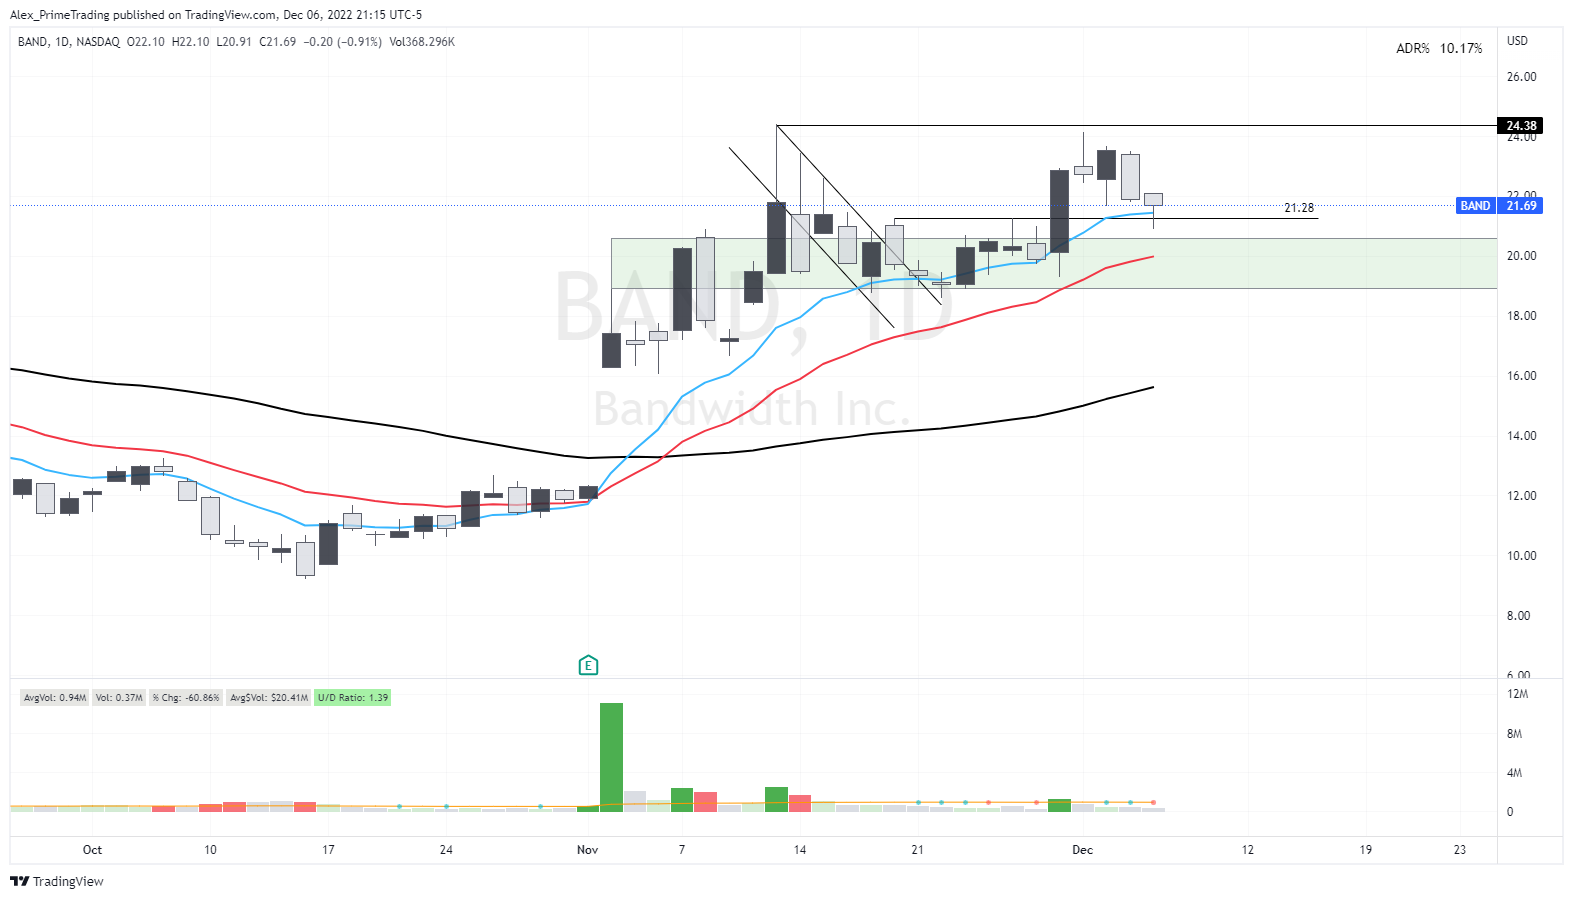
PRTA,RLX,AEHR,HZNP,GPS,WFRD,BIIB,BAND,ELF,ALGM,VCYT,IGT,SLB,CHX,SMCI,SLVM,NTNX,AER,LSCC,INSW,
Relative Strength 6 Month (6M-RS)
AEHR,CPRX,PRTA,ELF,TGTX,NTNX,CCRN,YPF,INSW,CELH,DHT,SMCI,VCYT,GMAB,PDD,ENPH,ARRY,CHWY,BIIB,GPS,
REFERENCES
Articles on the system:

I really hope that you enjoyed it. If you did, please share it & hit the LIKE button so that more folks can be reached and this Newsletter can grow. :)
I like the 2 new indicators!