PT Education Series - Alex's technical setups playbook 📒
FREE: Educational Article
Hi folks!
Many ask what are the setups I use in my trading, so I prepared an Educational Article to cover my playbook of chart setups I use each & every day to initiate my trades.
Alex’s technical setups:
Wedge break (WB)
Wedge break pullback (WBPB)
Breakout Retest short (BORS)
Breakout Retest Long (BORL)
Breakout 10ema PB (BO10PB)
Breakout 21ema PB (BO21PB)
BONUS: Second Entry / Higher Lows
That's my playbook, hope you’ll enjoy :)
1. Wedge break (WB)
Price forming an orderly pullback contained by a down trend line (DTL). You want to see low volume within that wedge formation, with small down swings ideally.
Then, you use the DTL breakout or breakout day’s high (FUTU = 59.27$) for pattern confirmation & entry.
Buy:
DTL breakout ideally on higher than avrg. volume, OR
PIVOT breakout daily high, OR
Intraday PIVOT breakout H1 high
Stop Loss:
Low Of Day (LOD), OR
Recent swing low
2. Wedge break pullback (WBPB)
After the WB, you often have a retest of the DTL, we then find support and follow through on the upside.
You want to see a good reversal on that DTL retest. Then, you use the breakout swing high for pattern confirmation & entry. (ENPH = 2.54$)
Buy:
PIVOT breakout ideally on higher than avrg. volume, OR
PIVOT breakout daily high, OR
Intraday PIVOT breakout H1 high
Stop Loss:
Low Of Day (LOD), OR
Recent swing low
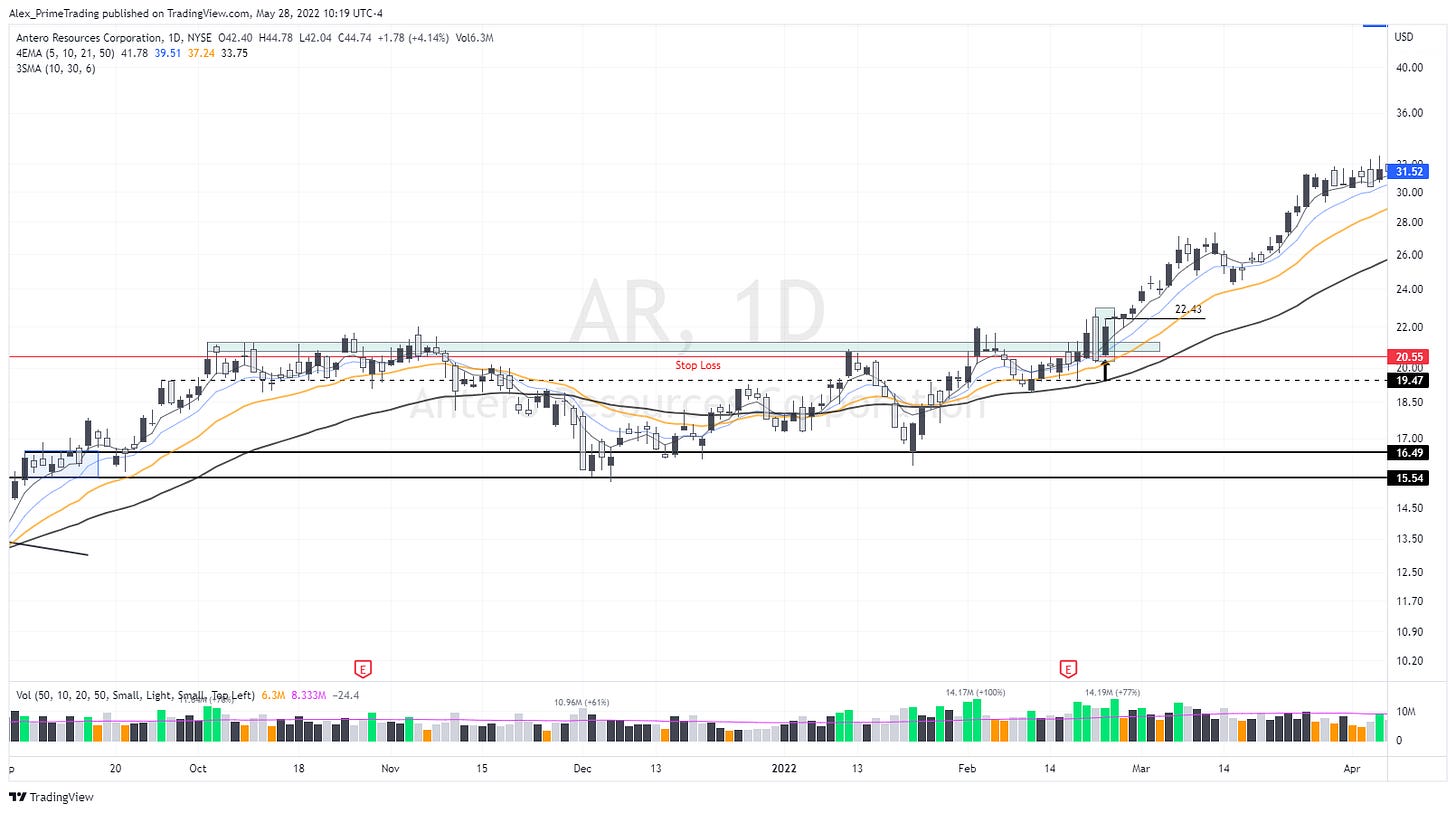
3. Breakout Retest short (BORS)
After a base breakout, the BORS setup takes place when price comes back testing the BO pivot within a short period only.
You want to see a ideally low volume on the retest and higher volume on the reversal. Then, you use the retest day high for pattern confirmation & entry. (AR = 22.43$)
Buy:
PIVOT breakout ideally on higher than avrg. volume, OR
PIVOT breakout daily high, OR
Intraday PIVOT breakout H1 high
Stop Loss:
Low Of Day (LOD), OR
Recent swing low
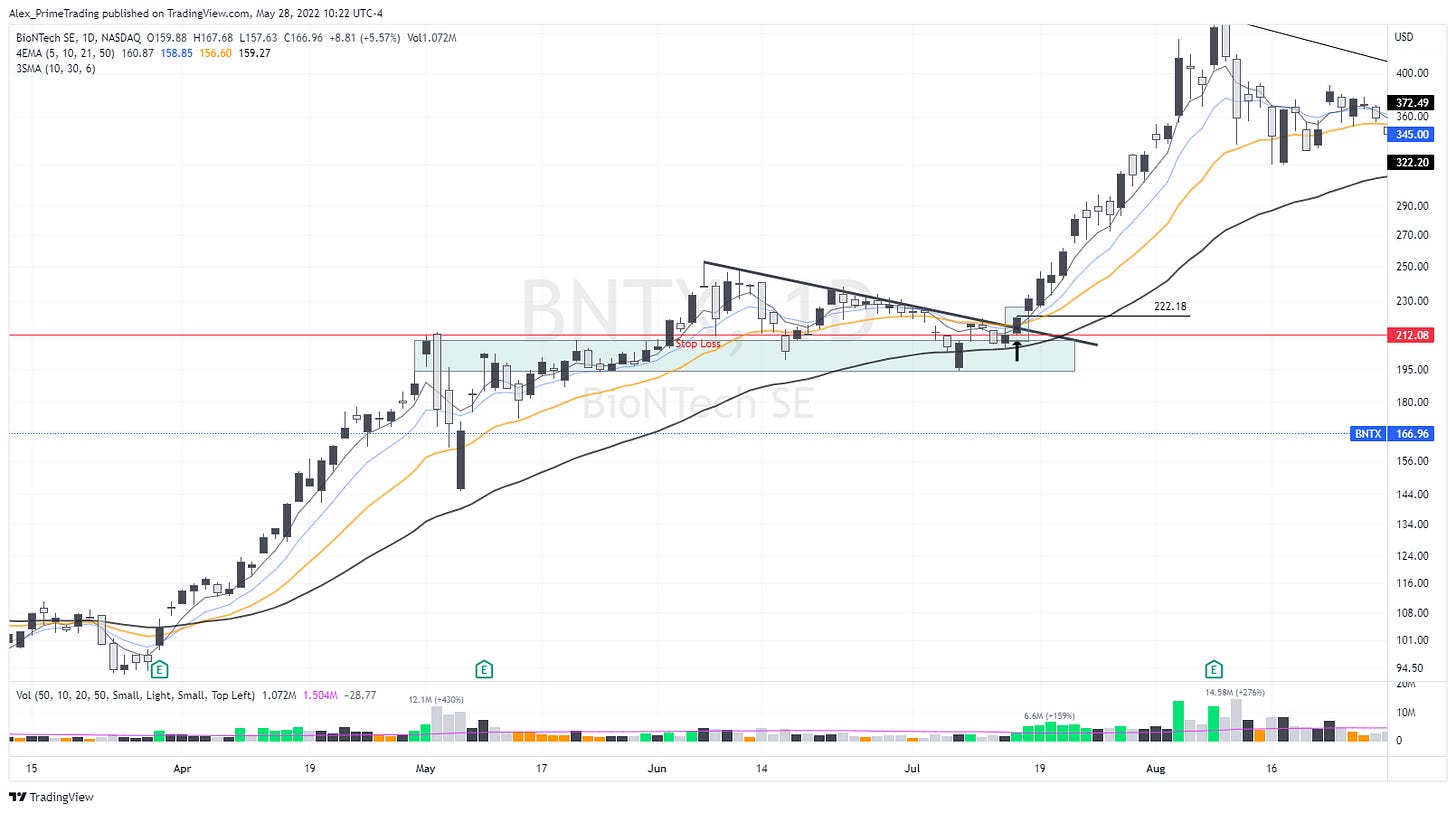
4. Breakout Retest Long (BORL)
Sometimes we breakout with a lot of strength, but we pullback during a couple weeks back to the BO level in a wedge pattern.
You want to see low volume within that wedge formation, with small down swings ideally.
Then, you use the DTL breakout or breakout day’s high for pattern confirmation & entry. (BNTX = 222.18$)
Buy:
DTL breakout ideally on higher than avrg. volume, OR
PIVOT breakout daily high, OR
Intraday PIVOT breakout H1 high
Stop Loss:
Low Of Day (LOD), OR
Recent swing low
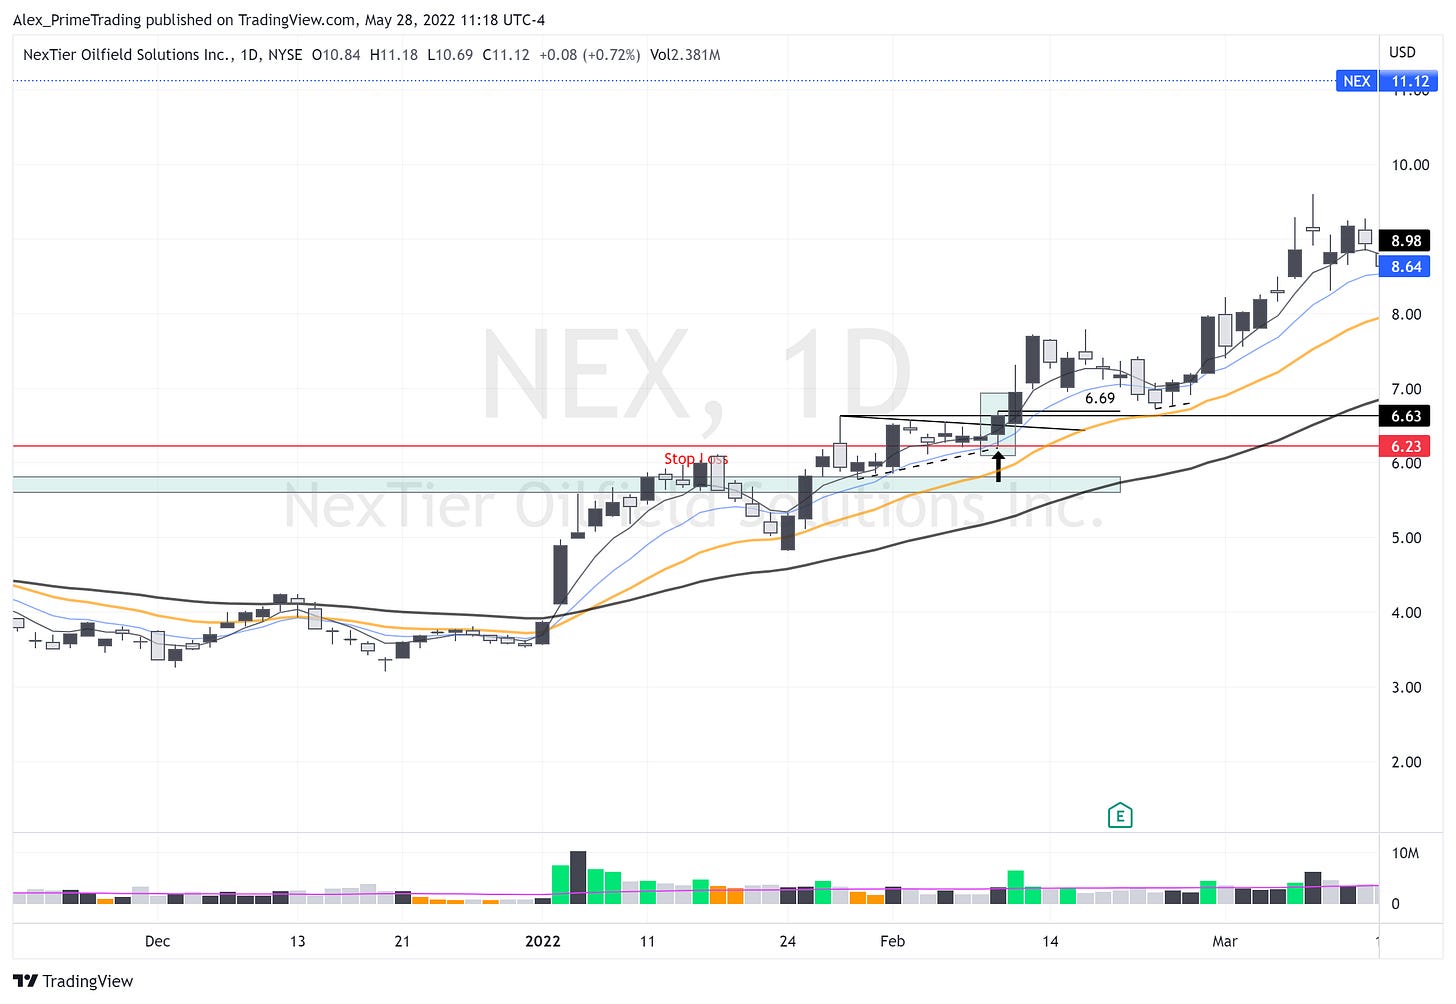
5. Breakout 10ema PB (BO10PB)
When the breakout is powerful & buying pressure is sustained, we don't always get a breakout level retest. In that case we might only get a pullback to the 10dma. You want to wait for that lower risk entry to form, specially if you missed the initial breakout.
Then, you use the DTL breakout OR breakout swing high (NEX=6.63$) for pattern confirmation & entry.
Buy:
DTL breakout ideally on higher than avrg. volume, OR
DTL breakout daily high (NEX=6.69$), OR
Intraday DTL breakout H1 high, OR
Breakout swing high PIVOT breakout daily high, OR
Breakout swing high PIVOT breakout H1 high
Stop Loss:
Low Of Day (LOD), OR
Recent swing low
6. Breakout 21ema PB (BO21PB)
When the breakout is powerful & buying pressure is sustained, we don't always get a breakout level retest. In that case we might only get a pullback to the 21dma. You want to wait for that lower risk entry to form, specially if you missed the initial breakout.
Then, you use the DTL breakout OR breakout swing high (DOCN=87.49$) for pattern confirmation & entry.
Buy:
DTL breakout ideally on higher than avrg. volume, OR
DTL breakout daily high (DOCN=82.78$), OR
Intraday DTL breakout H1 high, OR
Breakout swing high PIVOT breakout daily high, OR
Breakout swing high PIVOT breakout H1 high
Stop Loss:
Low Of Day (LOD), OR
Recent swing low
BONUS: SECOND ENTRY (SE) / HIGHER LOWS
In all these technical setups, there is always a price action characteristic that I look for and best powerful setups have in common. It’s the formation of HIGHER LOWS within the base, right before the DTL or BASE breakout.
Look for a first bounce of a level, retrace back on a second swing low but bounce higher & on higher volume (higher low). If you see that bonus price action at key levels (KMA's & pivots), it indicates that buying pressure is really building up. It's super bullish and my best trades had it.
I always mark them in dashed Up Trend Line (UTL) on my charts.
I really hope that you enjoyed. If you did, please share it so that more folks can be reached and this Newsletter can grow. :)


what would really help me is if you can put the BUYS and STOP loss on each chart and or the dollar amount after each BUY/STOP LOSS in the list
Hi Alex - last one of today. on the BORS example we break out of green area on t-2 candle, then we come back to retest on t-1 candle. Then we go again on t candle. The breakout on t candle pivot - shouldn't it be the high of the retest candle = t-1? Or am I misunderstanding it... Thanks a lot for everything.