


PT daily Update & Focuslist - 06/13
Selloff continues

Good evening folks,
Another day, another market selloff! Now, how job will be to find clues for extension & oversold signs on the downside where a potential reversal or rally could take place.
Let’s go!✌️
MARKET REVIEW


Market opened the week with a massive 2.8% gap down. This is a big gap that we don’t see often. Market never been able to rally and sold off hard all day to close 4.73% lower. This is exactly why I am talking for almost a week to play defense and protect your gains.
Now I am worried that we might see more selling as RTY momentum is building up in the last 4 days. Notice the increase in price change & volume picking up as well
-1.5% (vol 182k)
-2% (vol 237k & >avrg)
-2.7% (vol 259k & >avrg)
-4.7% (vol 309k & >avrg)
We also have many warning signs in secondary indicators than I follow to gauge the market health. Let’s check them out in details, as the FocusList risk to be pretty light tonight ;)
Yields about to inverse, again
An inverted yield curve occurs when short-term debt instruments have higher yields than long-term instruments of the same credit risk profile.
An inverted yield curve is unusual; it reflects bond investors' expectations for a decline in longer-term interest rates, typically associated with recessions.

Credit spreads continue to widens
A credit spread reflects the difference in yield between a treasury and corporate bond of the same maturity. Bond credit spreads are often a good barometer of economic health - widening (bad) and narrowing (good).

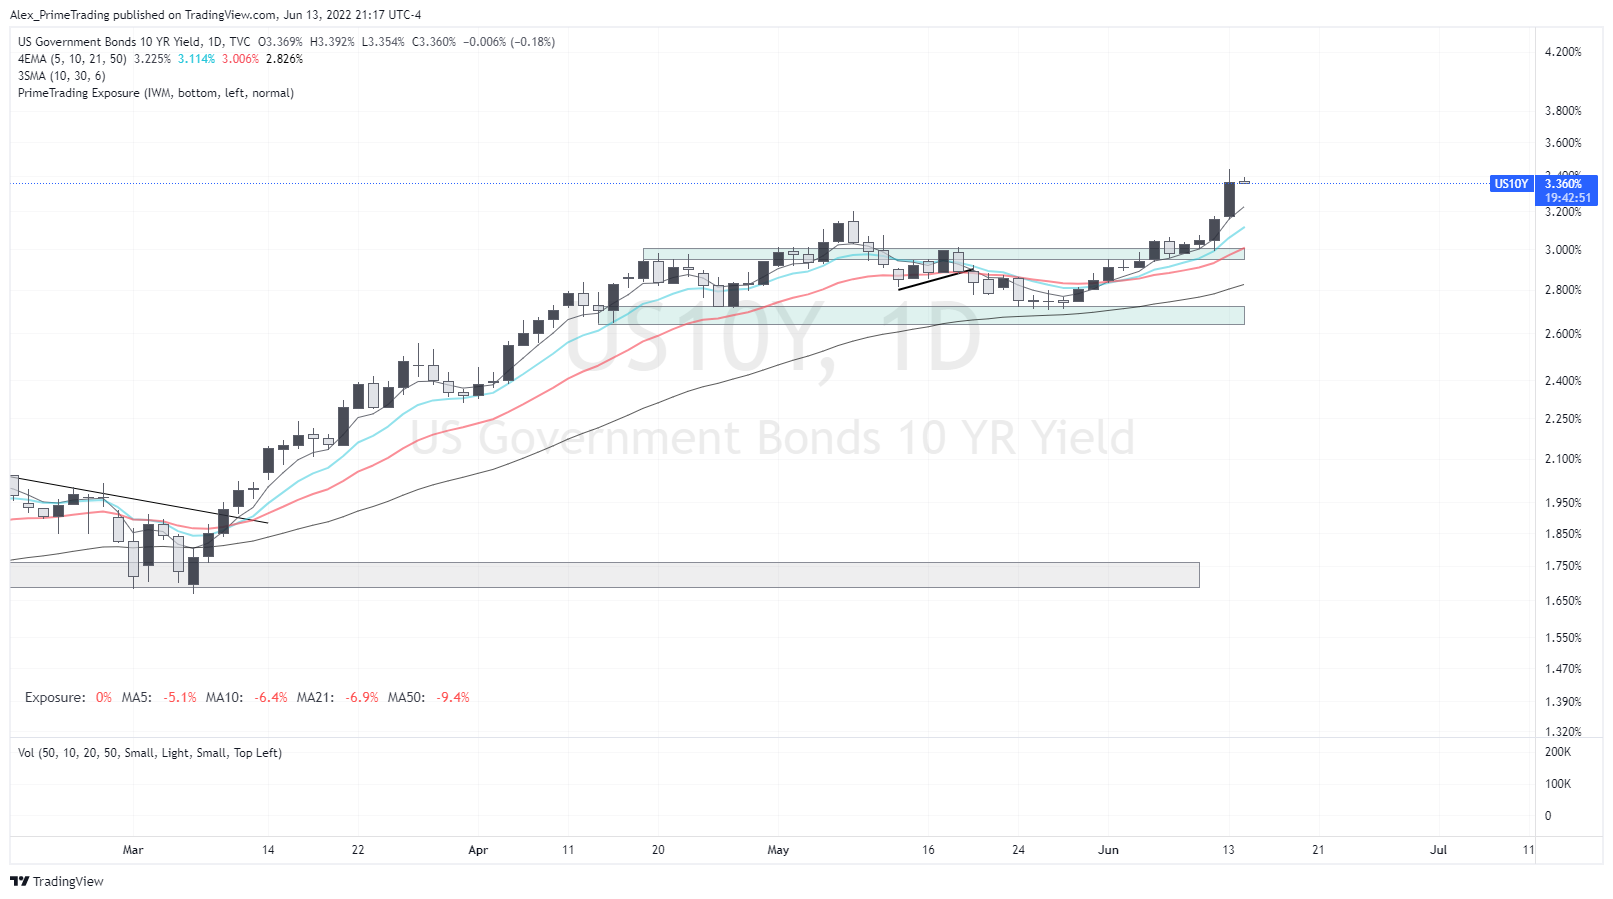
10Y&2Y bond yields surging
Why do higher bond yields hurt stocks?
When bond yields go up then the cost of capital goes up. That means that future cash flows get discounted at a higher rate. This compresses the valuations of these stocks. That is one of the reasons that whenever the interest rates are cut by the RBI, it is positive for stocks.
USD/CAD just jumped 3% in 3 days
The soaring dollar is propelling the global economy deeper into a synchronized slowdown by driving up borrowing costs and stoking financial-market volatility -- and there’s little respite on the horizon.

Equity put/call ratio still below 1
A rising put-call ratio, or a ratio greater than 0.7 or exceeding 1, means that equity traders are buying more puts than calls. It suggests that bearish sentiment is building in the market. Investors are either speculating that the market will move lower or are hedging their portfolios in case there is a sell-off.

Hope you enjoyed these secondary indicator I watch and are all pointing for more pain in the short term. They are ALL giving warning signs right now.
Trend is clearly down at this point and if you’re not playing defense yet, now you really want to be careful and backing down exposure. We know that we’re in a bear market, and we rejected the 50dma/10wma last week, so we could really be seeing the start of the next leg down right now. Keep in mind that we never had a climax and panic selling that normally ends corrections.
Bullish scenario:
Right now, a one day reversal would not act as a bullish scenario for me. It will take bottoming action before I even consider covering my short & putting back long exposure. Stay tuned when we’ll get there.
Bearish scenario:
First pivot of interest is 1698$ which was last May bottom, BUT also pre-COVID crash high. Next important level of interest is 1594$ from 2020 market rally structure. At this point, as long that we are below the 5dma and are not extended at least 15-20%, a bottom is unlikely to happen…but we never know right :)
MARKET BREADTH

NET new 1M & 52W LOWS on the NYSE & NDX. Total destruction with over 1k 1M lows on both the NYSE & NDX.
McClellan now at -255, so we just trigged my oversold level here. We can stay oversold a couple days while being in market selloff, so I keep it on the back of my head.
Stocks > 50dma continue to selloff and now back at 15%. We begin to be in the oversold area. Note that if it’s a real selloff like ‘08, ‘00, etc. We went even lower than 10, so keep that in mind.
VIX Opened the week in the 30’s and close at 34. Now we’re getting somewhere… Note that if we really flush in the next few days, we want to see readings above 38 and even around 50 for a real chance to bottom.

ECONOMIC CALENDAR
Big week again. We have Interest rate decision and FOMC on Wednesday. This will definitely move the market, so be carful around this time.
Market begins to price in a 0.75% rate hike on Wed…which we didn’t see before CPI data last week. We were around 2-4% probability before CPI & 23% this wknd…now 92.7%!!


SECTORS PERFORMANCE

Everything is being taken out, nowhere to hide…
Crude Oil (CL_F) continues to show strength and is now forming a BO10PB setup above 119.98$ pivot.

PORTFOLIO UPDATE

Still managing my TZA position right now. I will probably use the 5dma for my next scale out & the 10dma for my final. I might also take off bits here & there if we gap down or get really really extended below fast ema’s. Stay tuned.
You want to PLAY DEFENSE first, this is a SHORT or CASH market right now, make no mistake.
New positions:
Trimmed positions:
Closed positions:
DAILY FOCUSLIST
0 names in my FocusList tonight
Every names are being taken out, even the strongest sectors. BORR from last night FocusList performed well, but today’s action was so ugly that you don’t want to have any long exposure tbh.
I noticed a lot of hammer candles on 10, 21 & 50dma in recent strong names while scanning tonight. I’ll watch closely there names tomorrow to see if they can hold these levels and form some nice consolidations that we can get good R/R setups eventually.
Be patient, let the opportunities form and we’ll be there to catch them when ready ;)
Keep reading with a 7-day free trial
Subscribe to PrimeTrading to keep reading this post and get 7 days of free access to the full post archives.