PrimeTrading is an equity SWING trading community to learn & trade alongside experienced traders. It's like sneaking into a trader's POD, where you can see us execute & discuss...but in ours, you can also interact and ask questions.
I would have killed for such an opportunity when I started trading! 🔥
Education & mentoring from Alex & experienced traders.
See how I execute intraday while I share all my trades with explanations live.
Alex's daily market commentary, Portfolio updates, trade explanations, and daily FocusList.
Share & Discuss potential trade ideas with an amazing, like-minded community.
Talk Sectors, Macro Economy, Cryptocurrencies & much more!
Talk about mental game & psychology to evolve as a trader!
Live trading and Q&A live sessions 2x week.
Trade & learn with us, from Novice to Expert!
Cheers, Alex 🛡️✌️
MARKET ANALYSIS
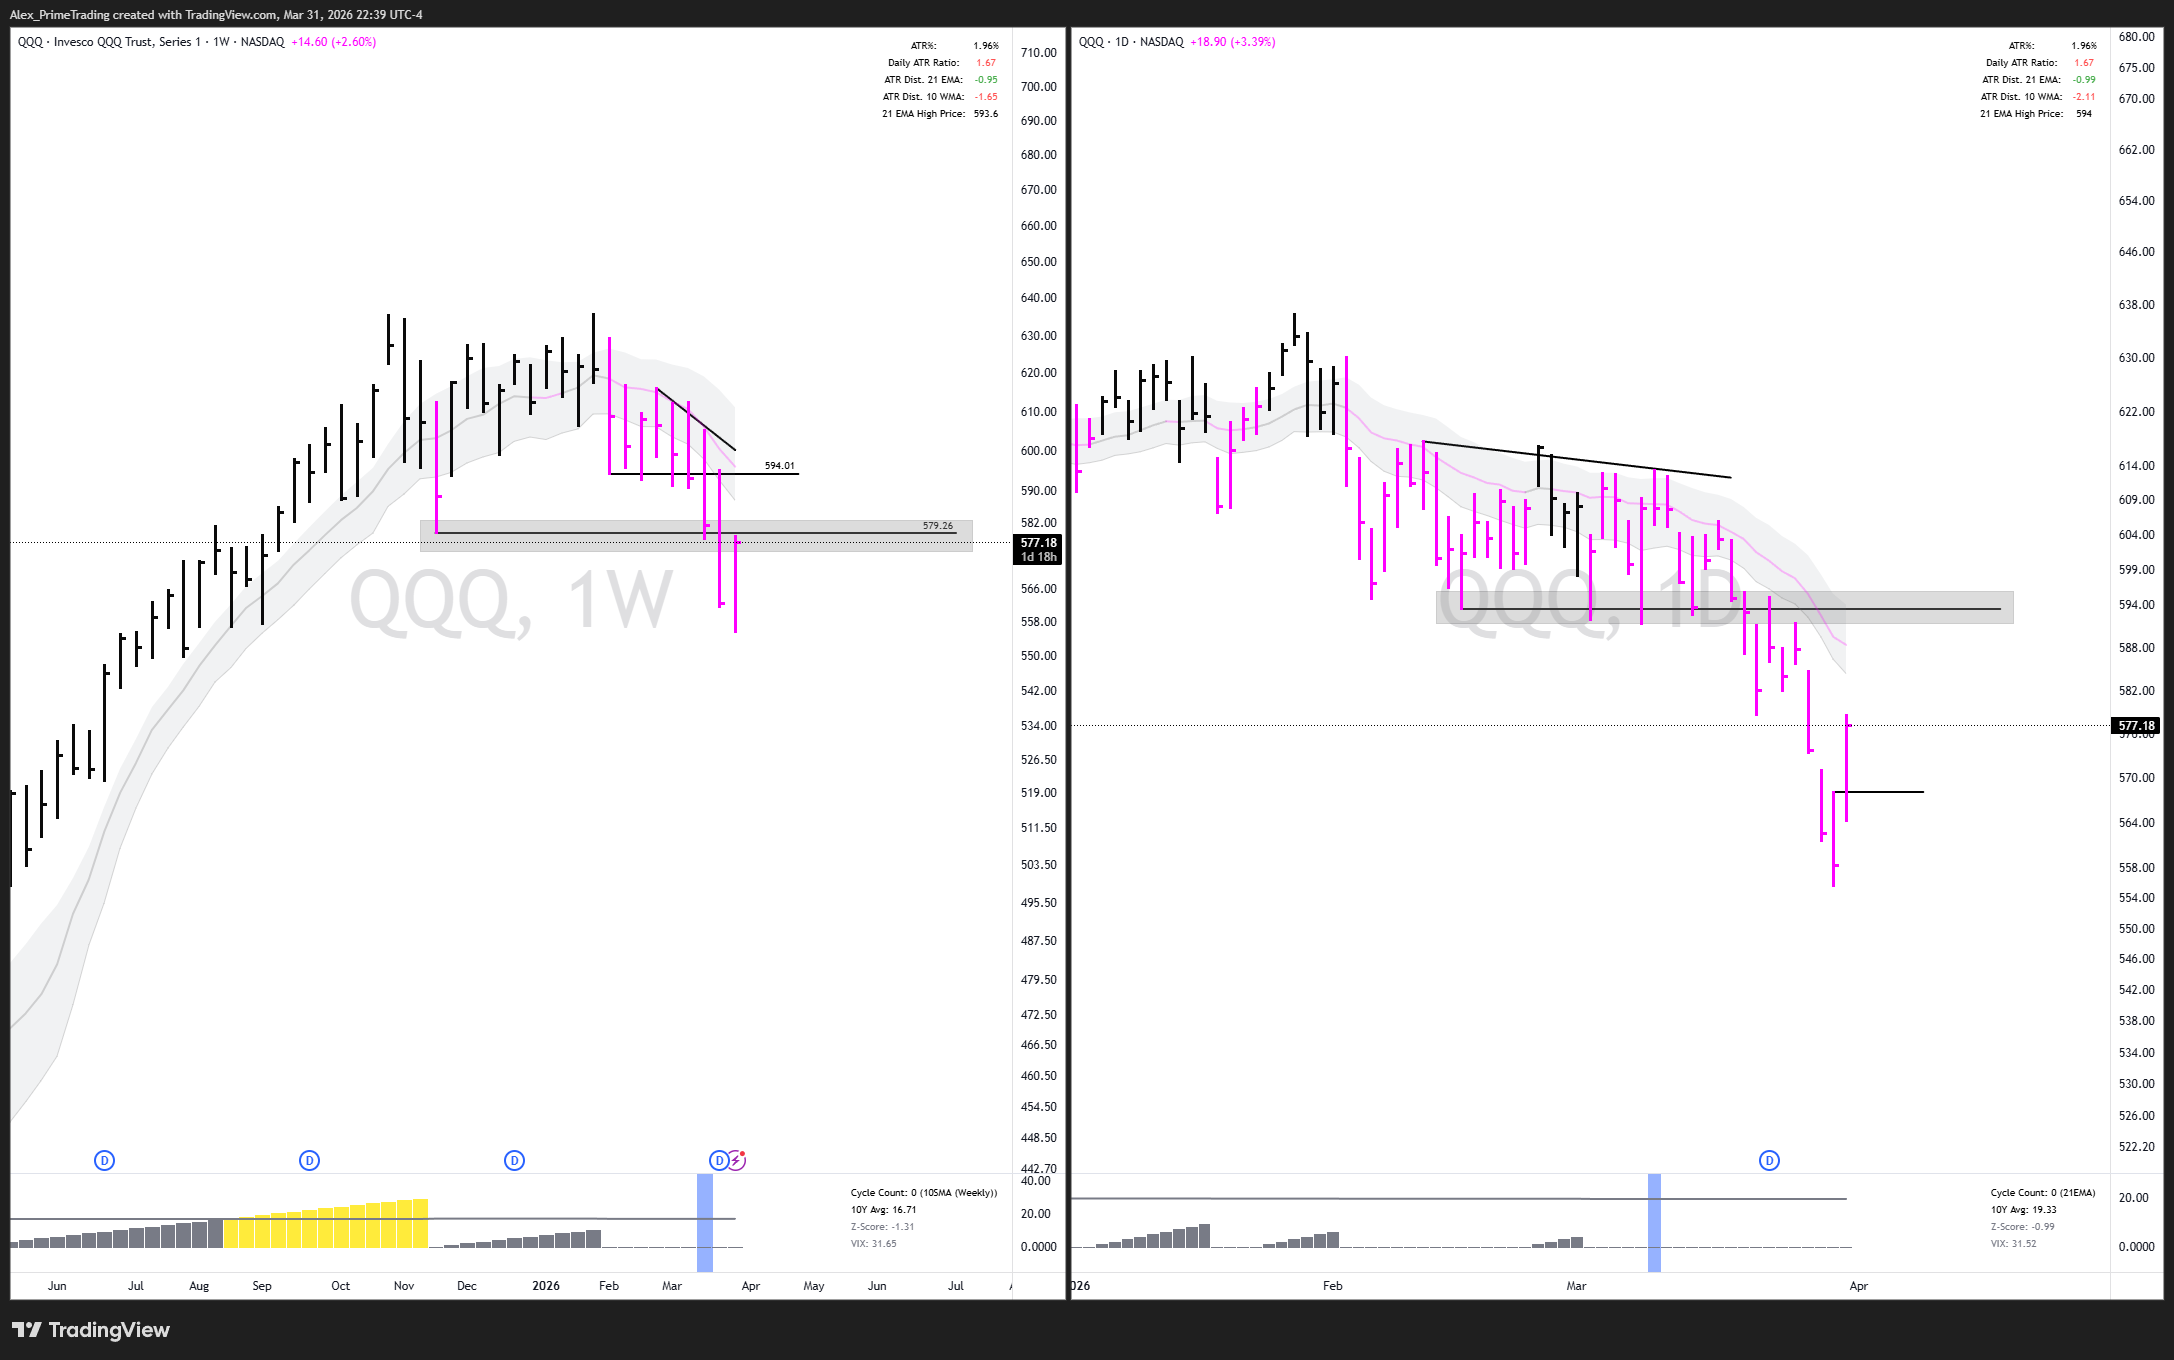
$QQQ PRICE ACTION (WEEKLY/DAILY)
Weekly in a DOWNTREND BELOW DECLINING 10wma-structure. Less extended at -1.65xATR.
Daily in a DOWNTREND BELOW DECLINING 21dma-structure. Less extended at -0.99xATR.
Downtrend continues, on both the daily & weekly timeframes. With today’s violent bounce, we confirmed a daily reversal and a retest of the 579.26$ base structure on the weekly timeframe. We are still in a downtrend, but we’ll have to start looking for clues of either constructive or weak action.
daily-structure reclaim?
daily-structure rejection?
daily-structure rejection & higher low?
daily-structure rejection & new low (downtrend reconfirmation)?
Many scenarios to look for in the next few days as we head to retest overhead supply.
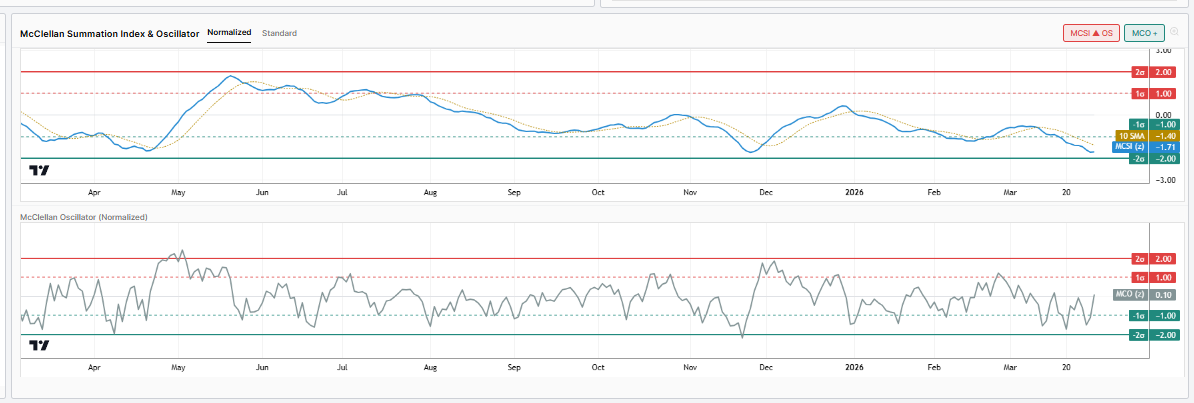
BREADTH $QQQ McClellan Oscillator/Summation (MCSI/MCO)
- MCSI UPTREND BELOW DECLINING 10dma & OVERSOLD. (-1.71σ)
- MCO NEUTRAL. (+0.1σ)
MCSI hooked-up today, could it follow-through tomorrow? Note that we are still below declining 10dma.
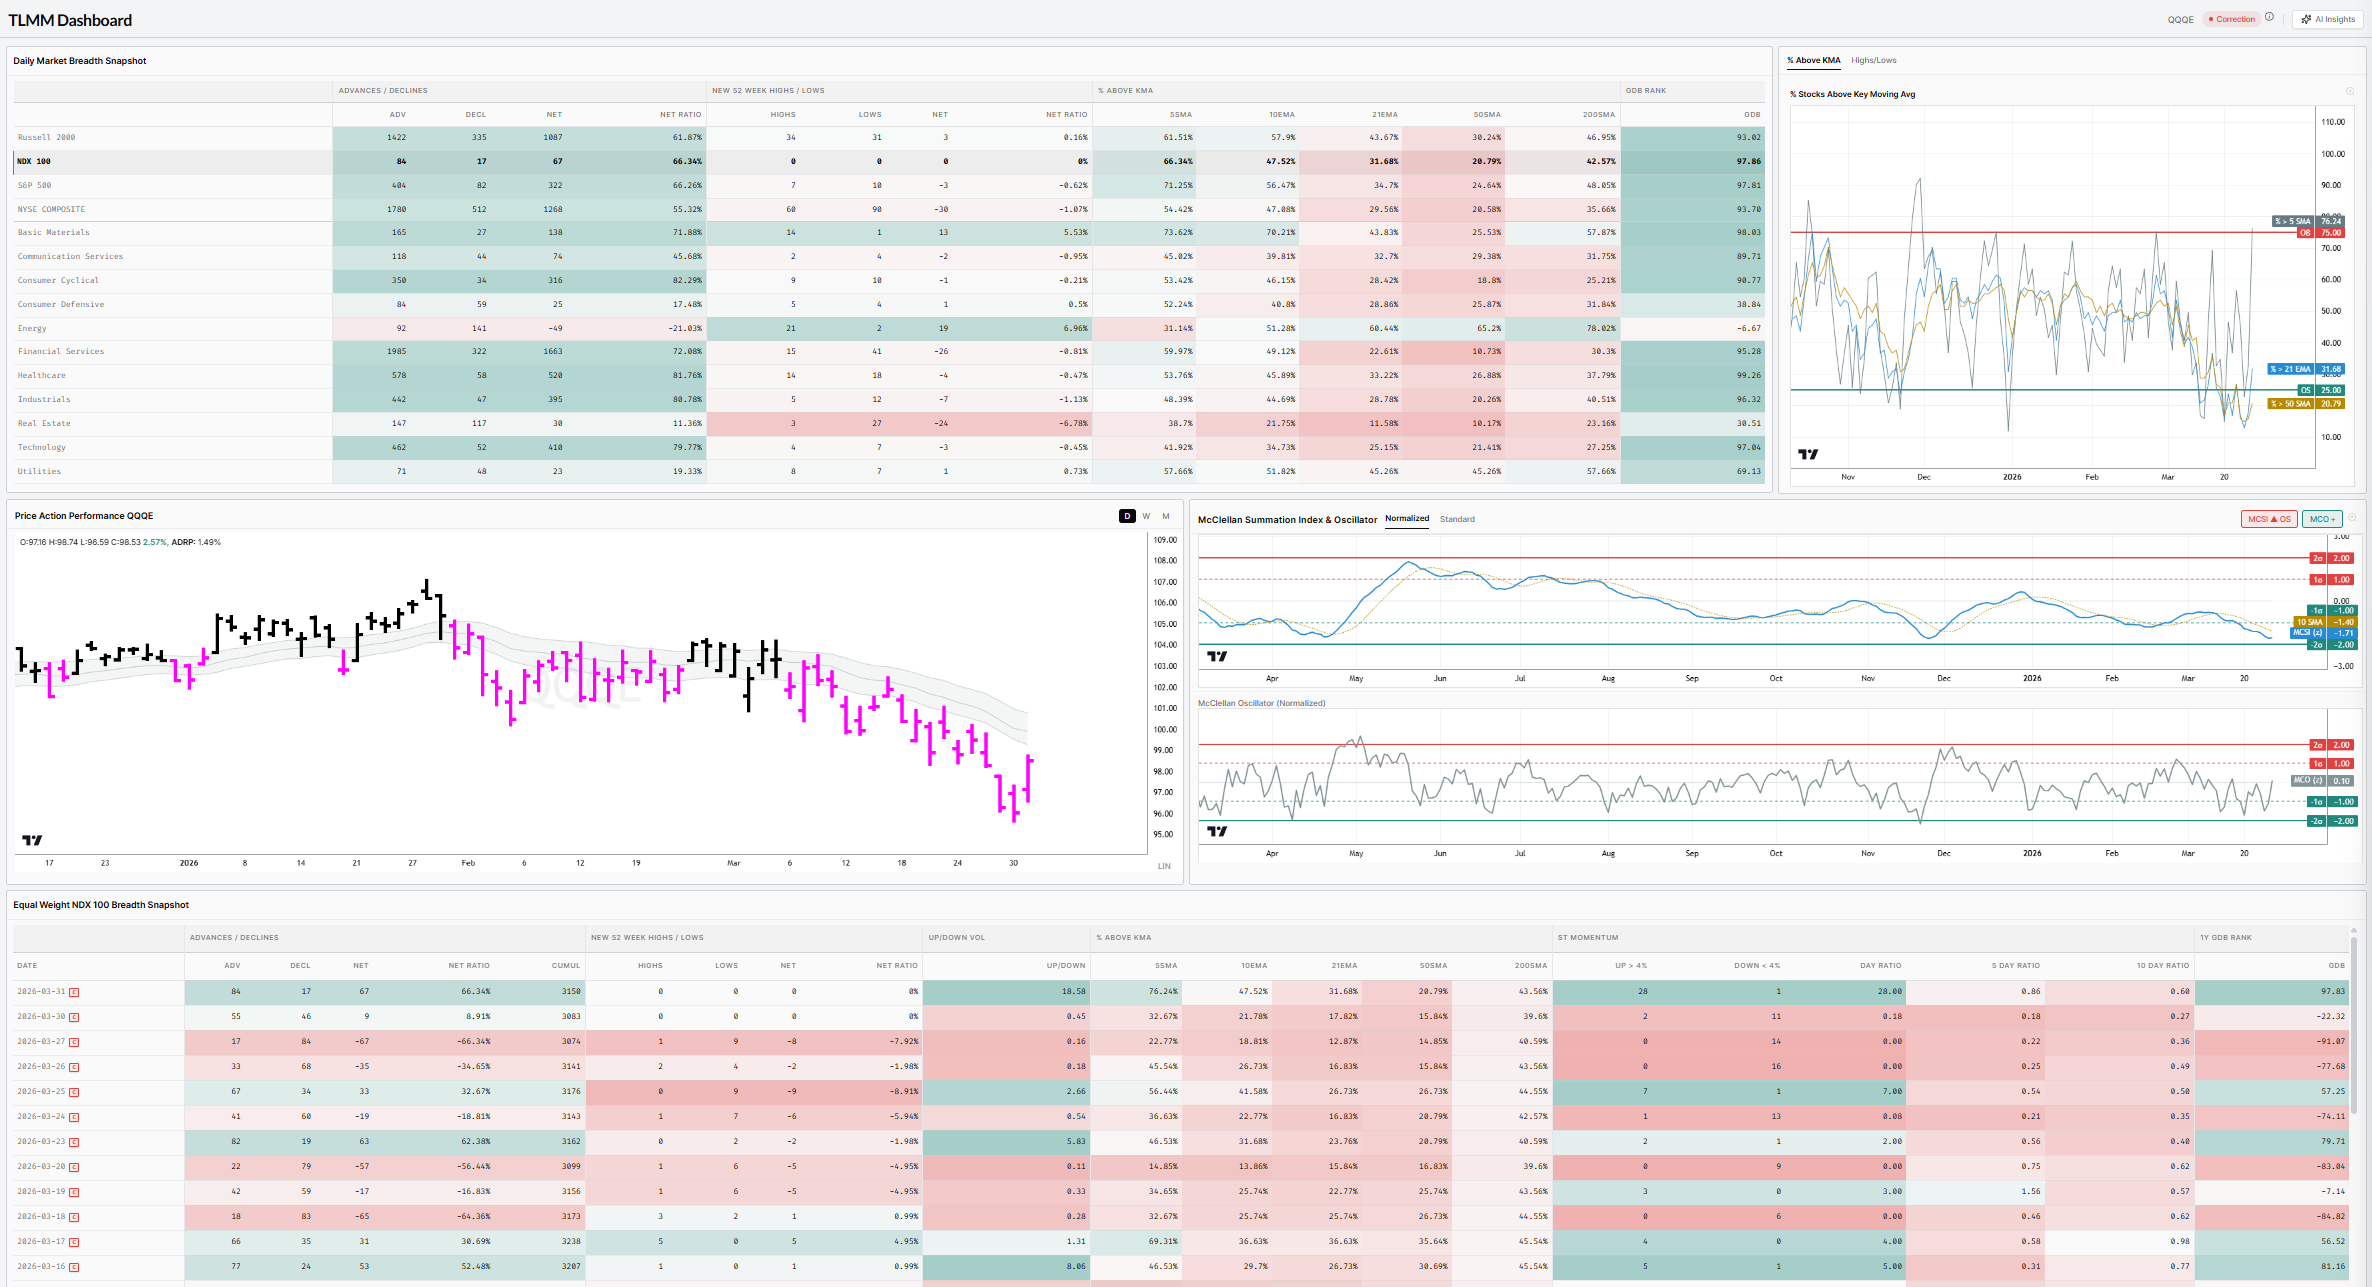
360° MARKET VIEW $QQQ TLMM Dashboard
The structural setup is unambiguously corrective. Price is below both key moving averages, neither is rising, and leadership expansion has stalled (cumulative net highs/lows at 2872 vs 50-day average of 2877). The recent daily breadth thrust (+125.5 GDB yesterday) and positive advance/decline net (+67) are consistent with a reflexive bounce within a downtrend, not a trend reversal signal.
Key watch: whether MCSI can reclaim its 10-day moving average (currently at 96.7) to signal breadth stabilization. Until participation metrics (% above 50-SMA, % above 21-EMA) move materially higher and price reclaims the 50-SMA, the correction remains intact. The extreme up/down volume ratio (18.6x) is notable but occurs frequently during corrective bounces and does not override the weak participation structure.
Confirmation of reversal would require price above 50-SMA with rising participation and MCSI above its 10-day average sustained over multiple days.
MARKET INTERNALS
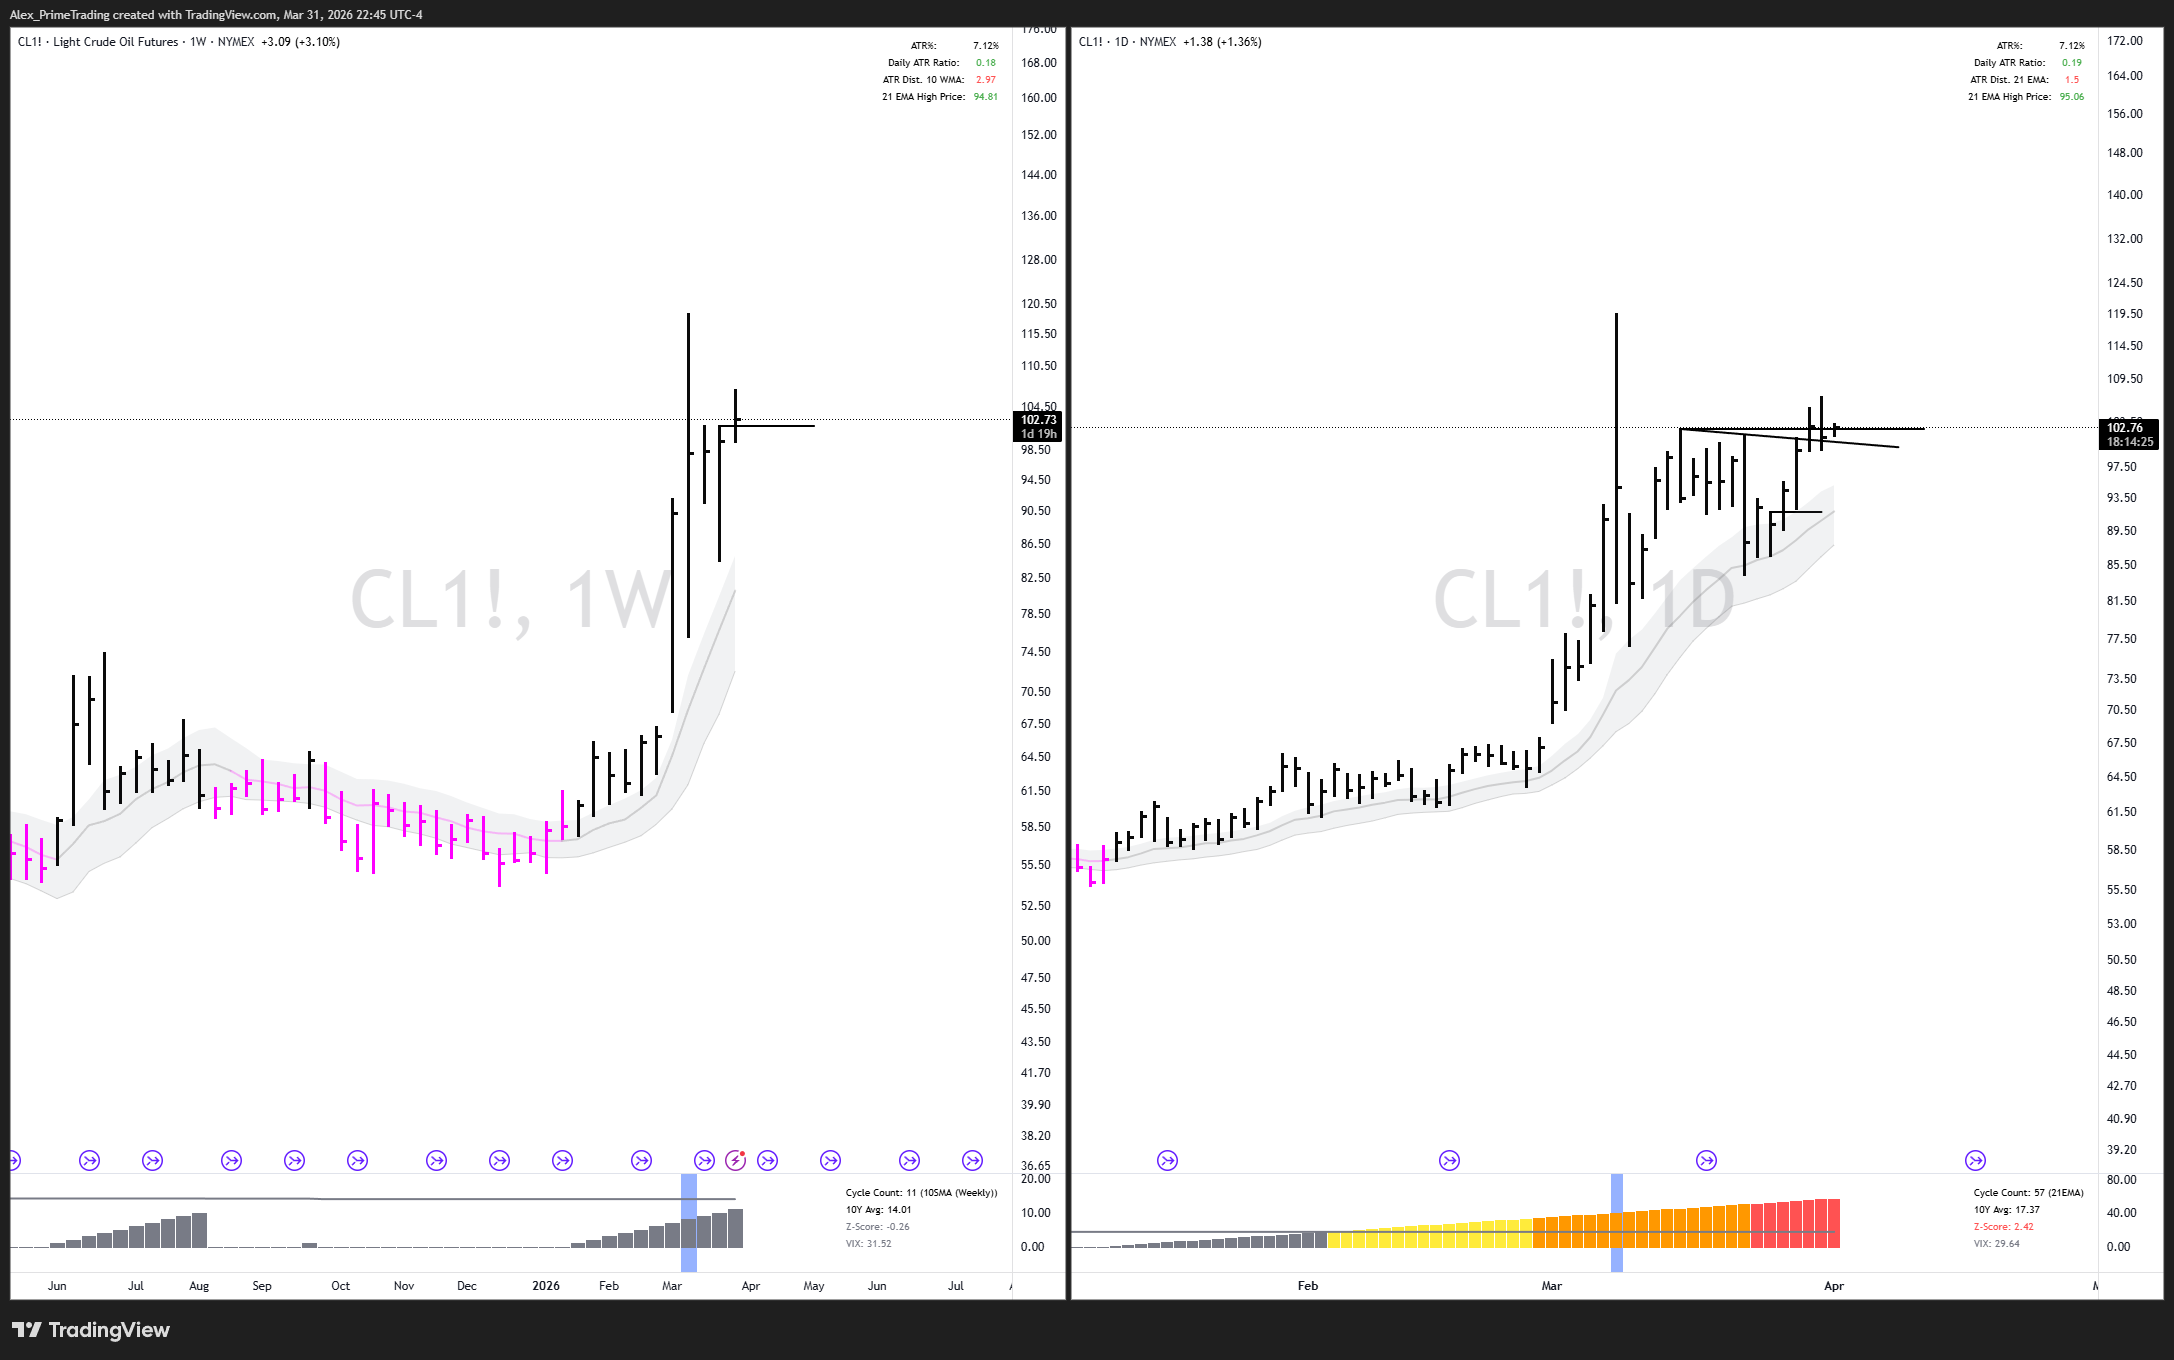
Crude Oil (WTI Crude Oil futures)
This #CL_F chart is driving the market right now; the inverse correlation is near-perfect, even on a tick-by-tick basis. Market fears high Crude Oil prices.
Rejection of recent highs today on that potential peace news. Still in an uptrend above rising 21dma-structure and holding that base structure as well.
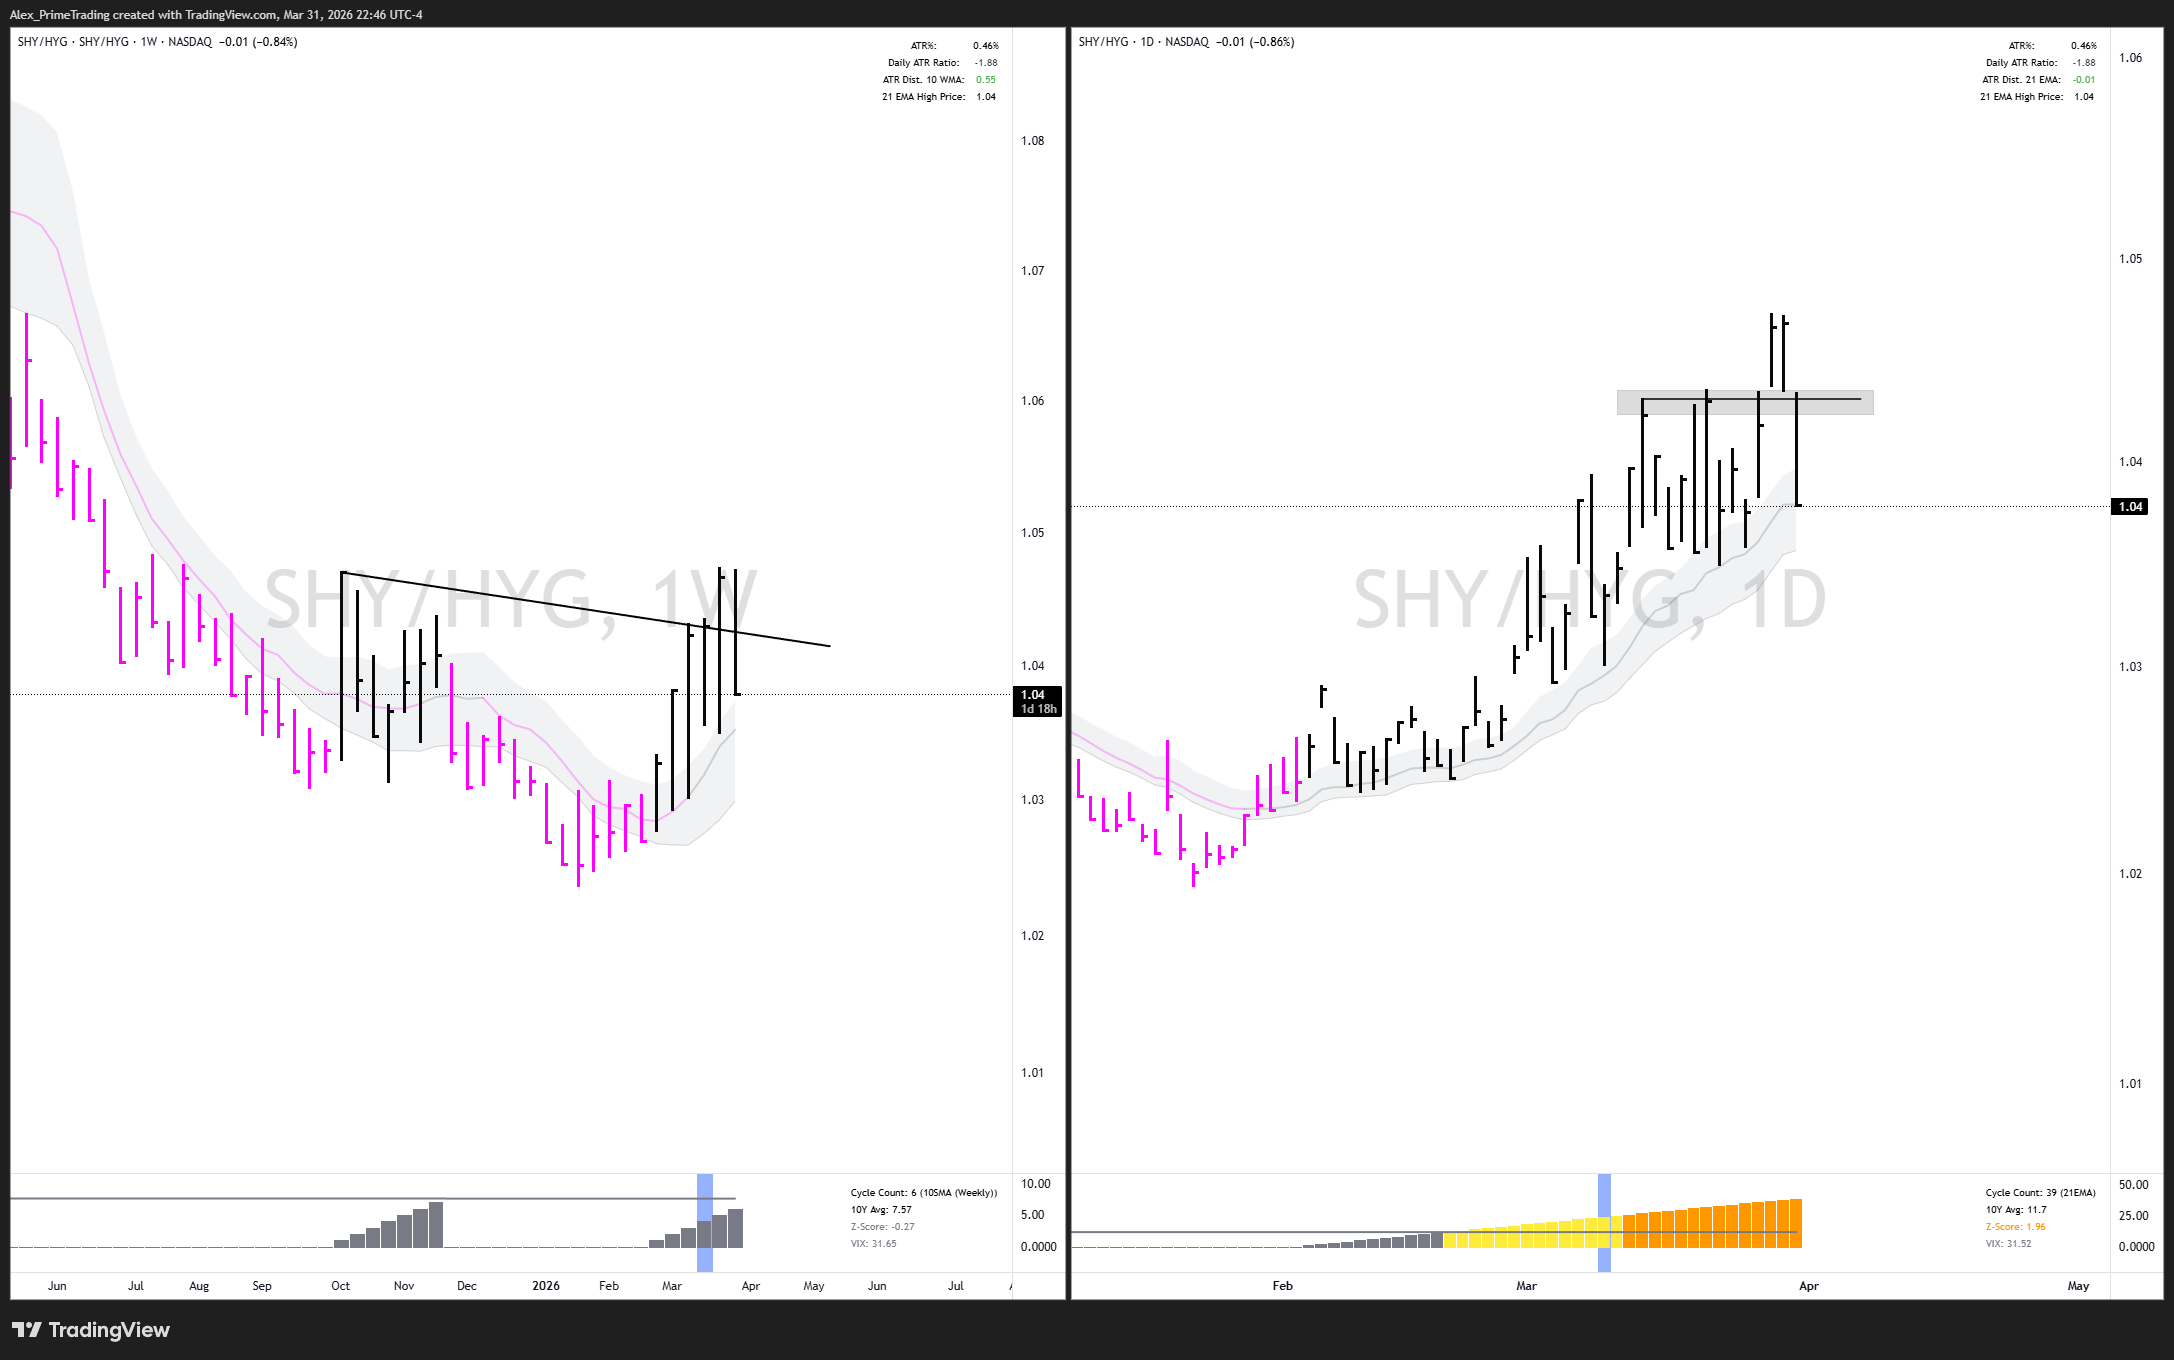
Credit Spreads (SHY/HYG)
Credit Spreads UPTREND ABOVE RISING daily & weekly structures. Retest of the daily-structure today. Bounce or Break?
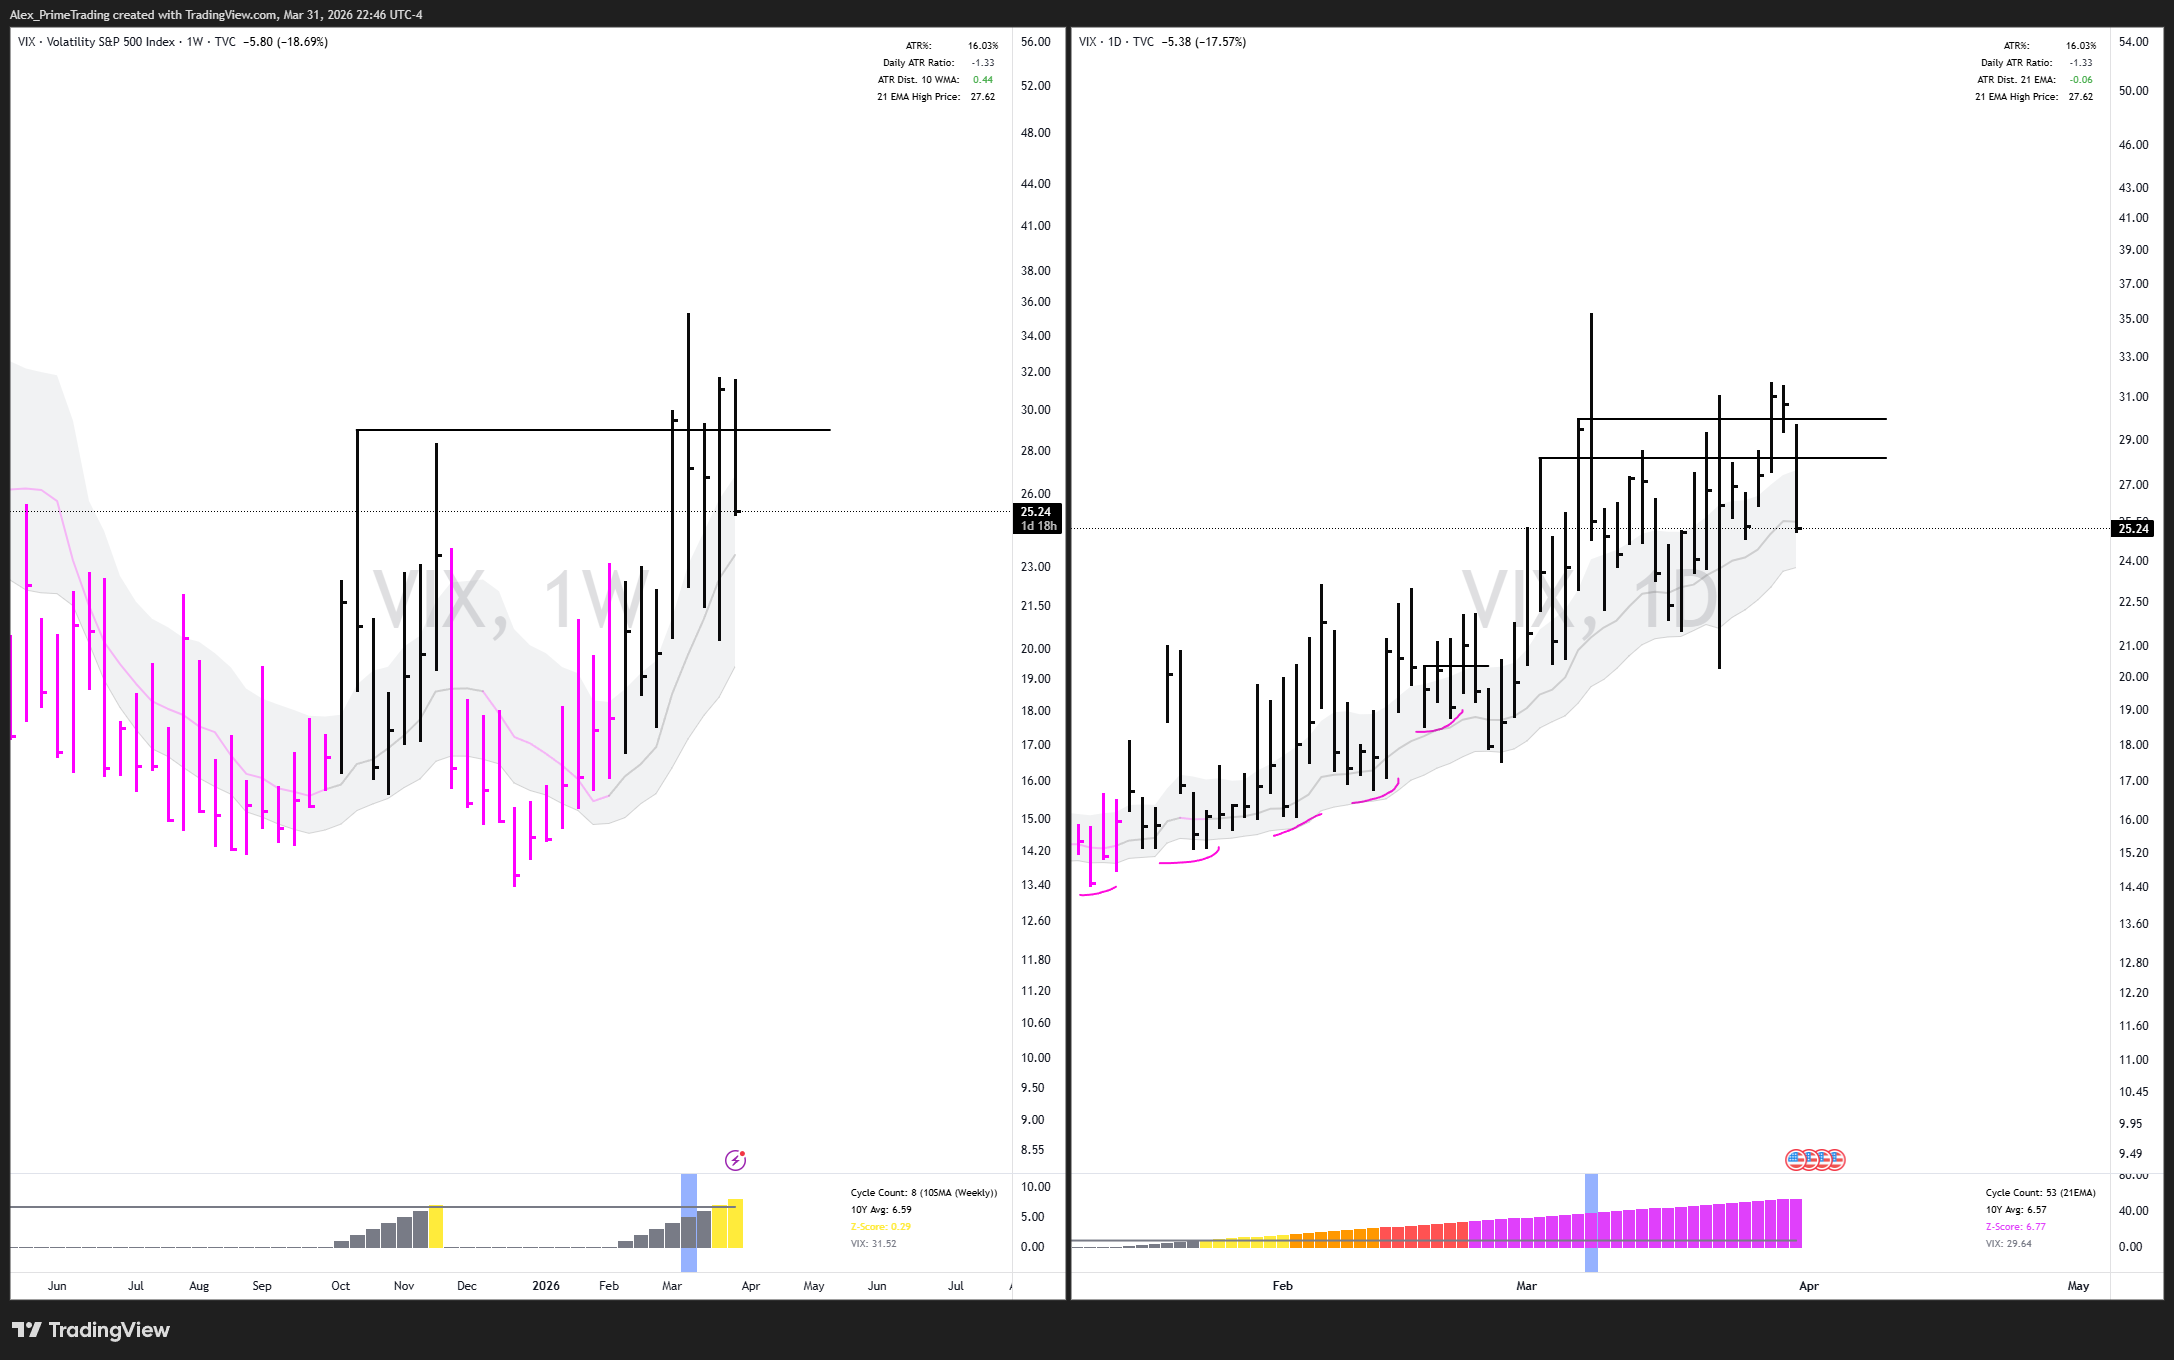
VIX (Volatility S&P500)
VIX UPTREND ABOVE RISING daily & weekly structures. Retest of the daily-structure today. Bounce or Break?
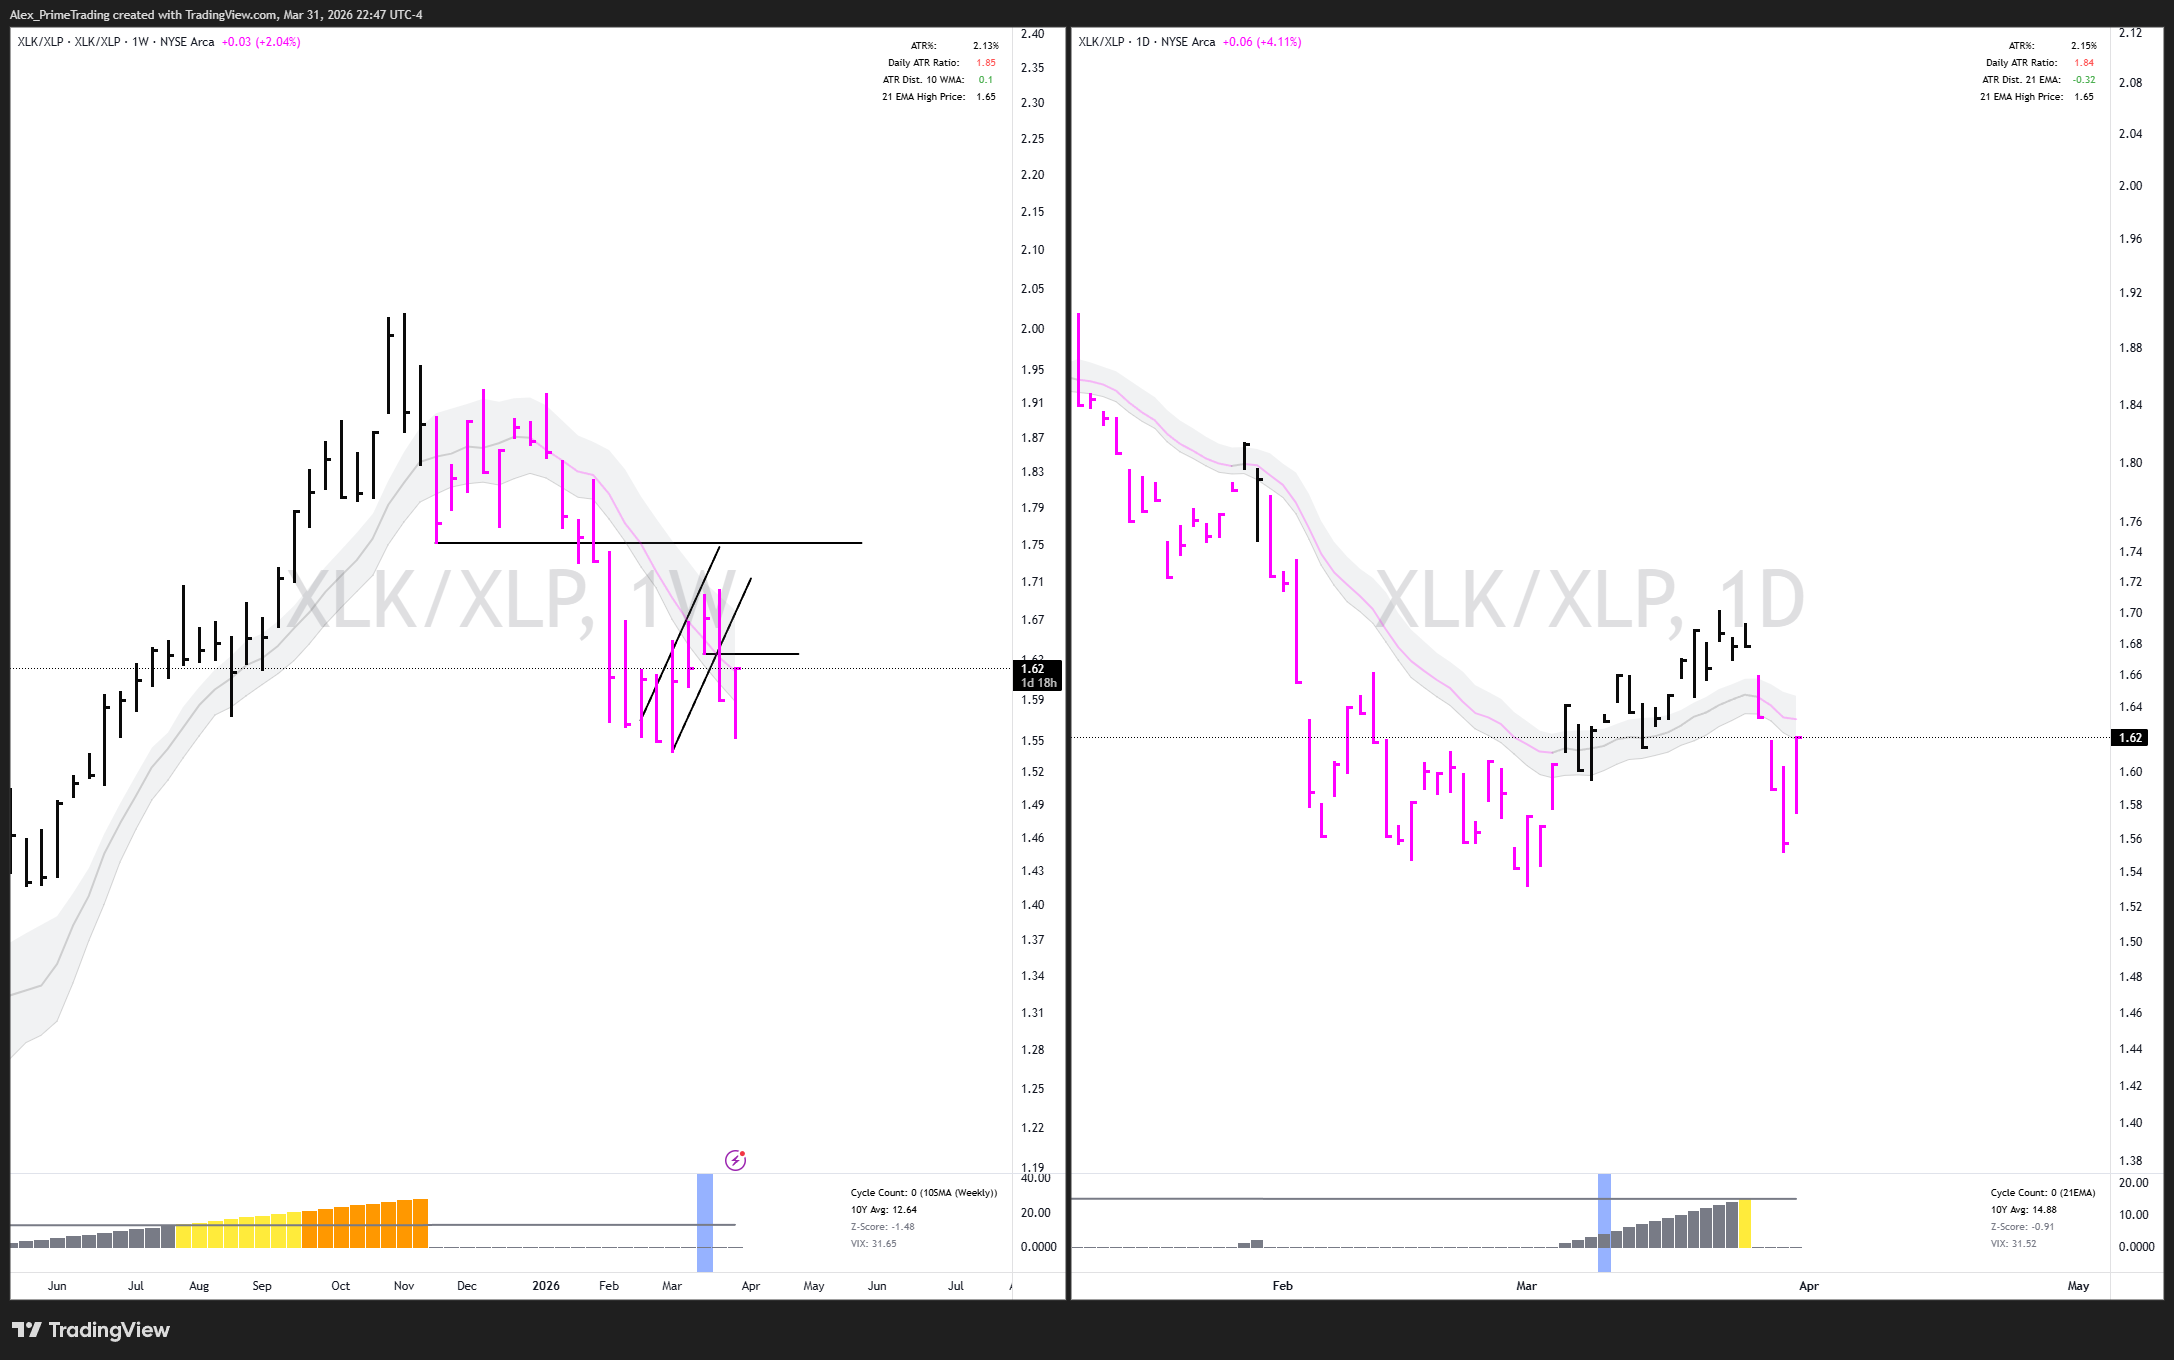
SECTORS ROTATION XLK 0.00%↑ / XLP 0.00%↑
XLK/XLP (Tech/Defensive) DOWNTREND BELOW DECLINING 21dma-structure and RETEST at the declining 10wma-structure last week = Tech → Defensive rotation = CAUTION.
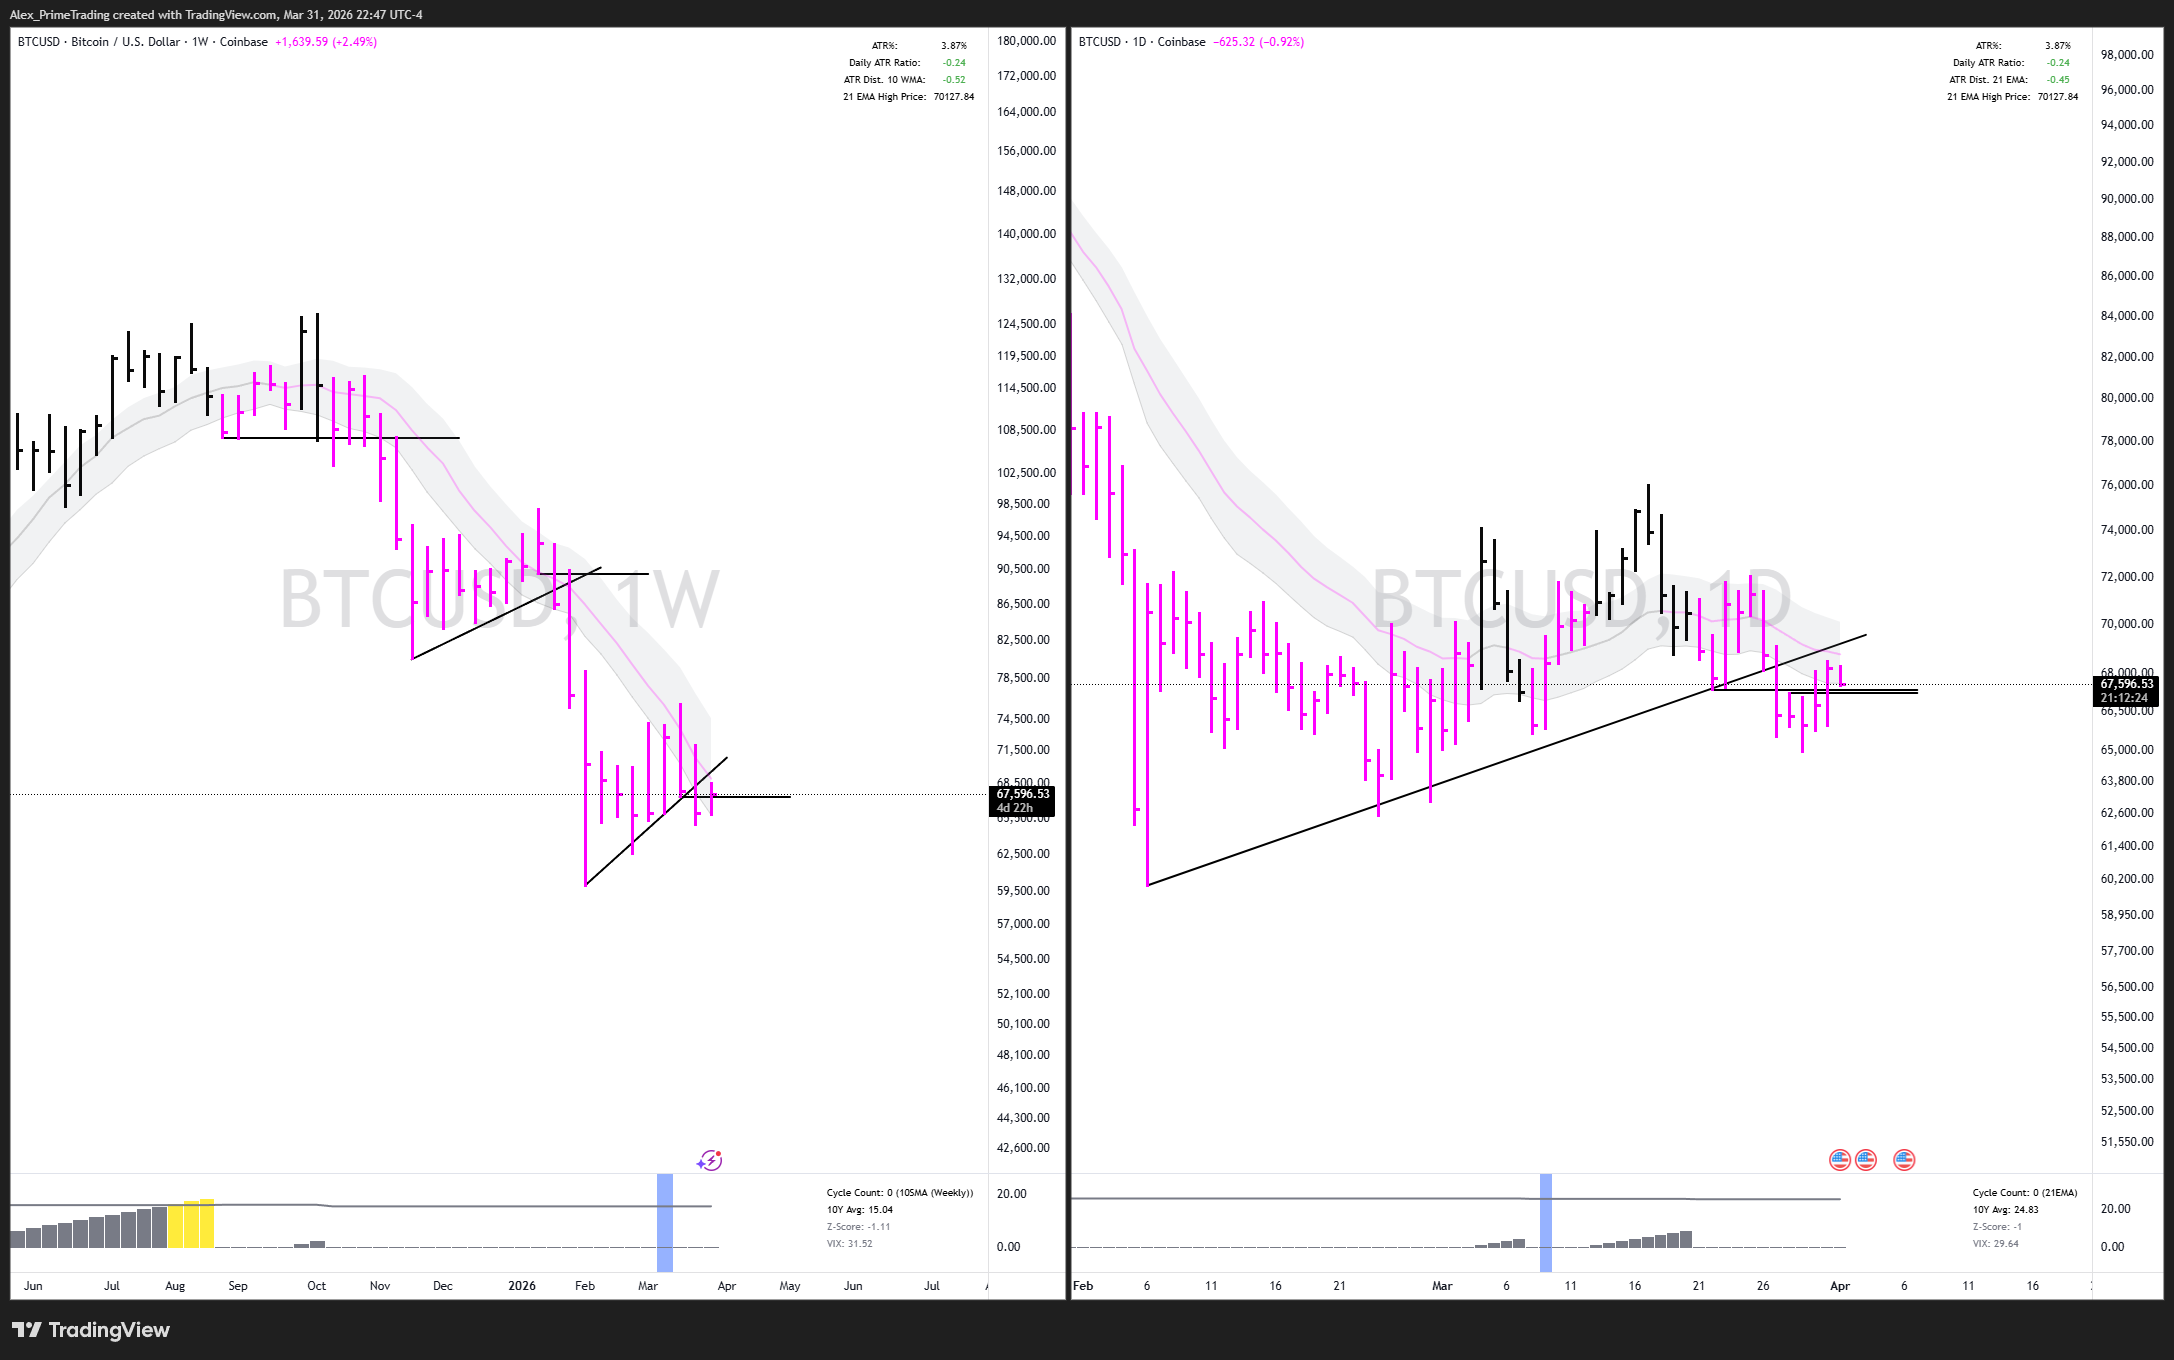
#BTC (Bitcoin)
Bitcoin (BTC) DOWNTREND BELOW DECLINING 21dma & 10wma structures. Retest of those structures right now. Rejection or reclaim?

Try TradersLab.io — your faster research workflow.
Build your plan in minutes with top-down market dashboards, sector/money-flow views, and screeners that drill down to leading stocks—all in one platform.
It’s the same set of TradersLab scans I use to build my Focuslist, now in an app built for every swing or position trader’s daily routine.
Open the app → TradersLab.io
Try it 1-month FREE with the code “TRIAL”.
SECTORS & THEMES
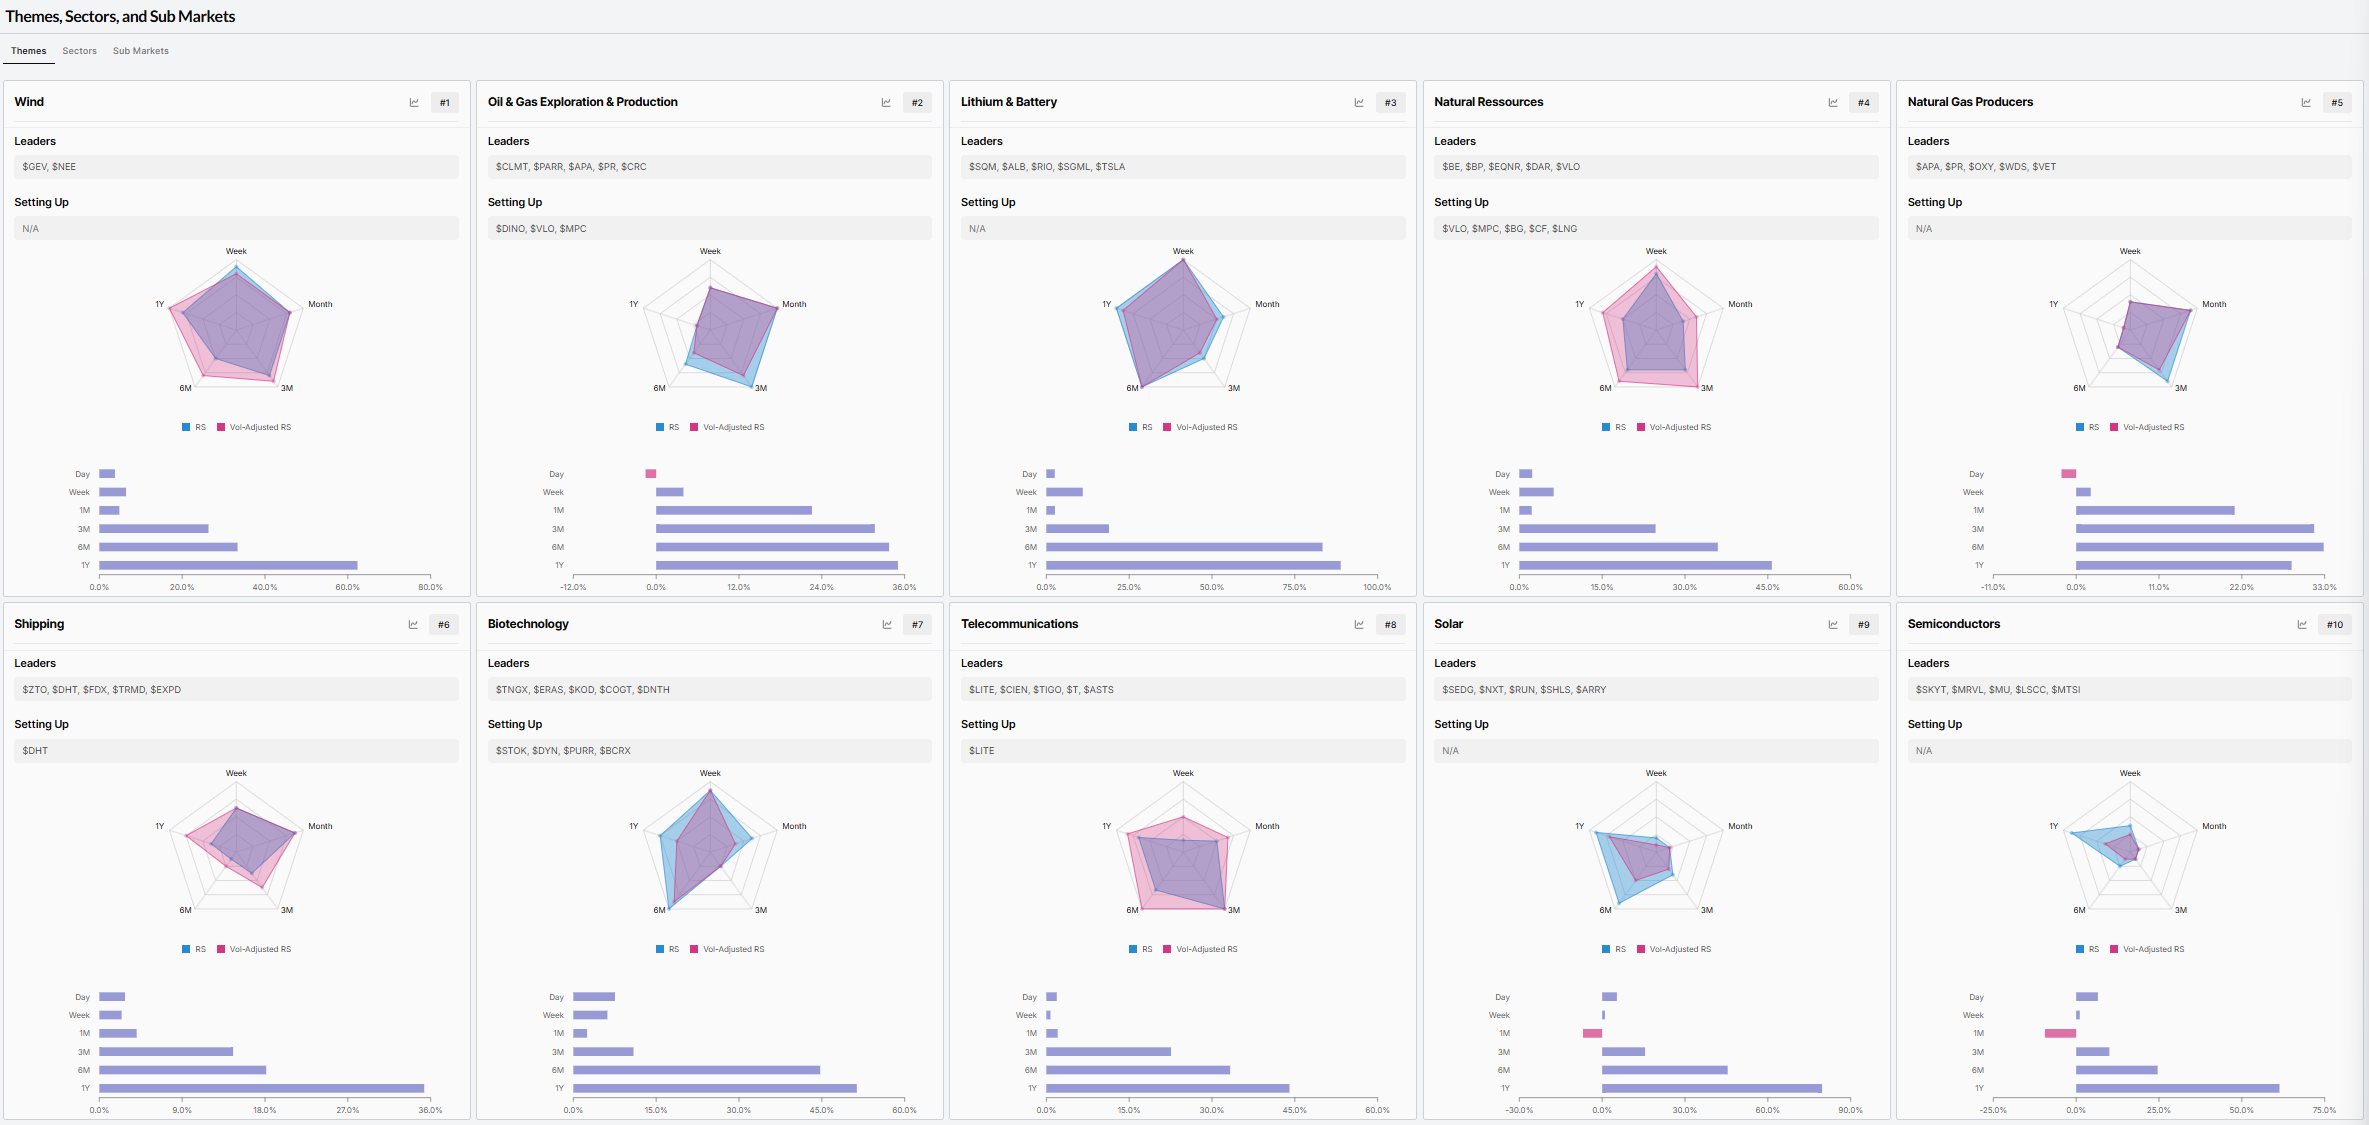
Top 10 Leading THEMES - Relative Strength RANK sorted (W/ Leading & Setting up Stocks)
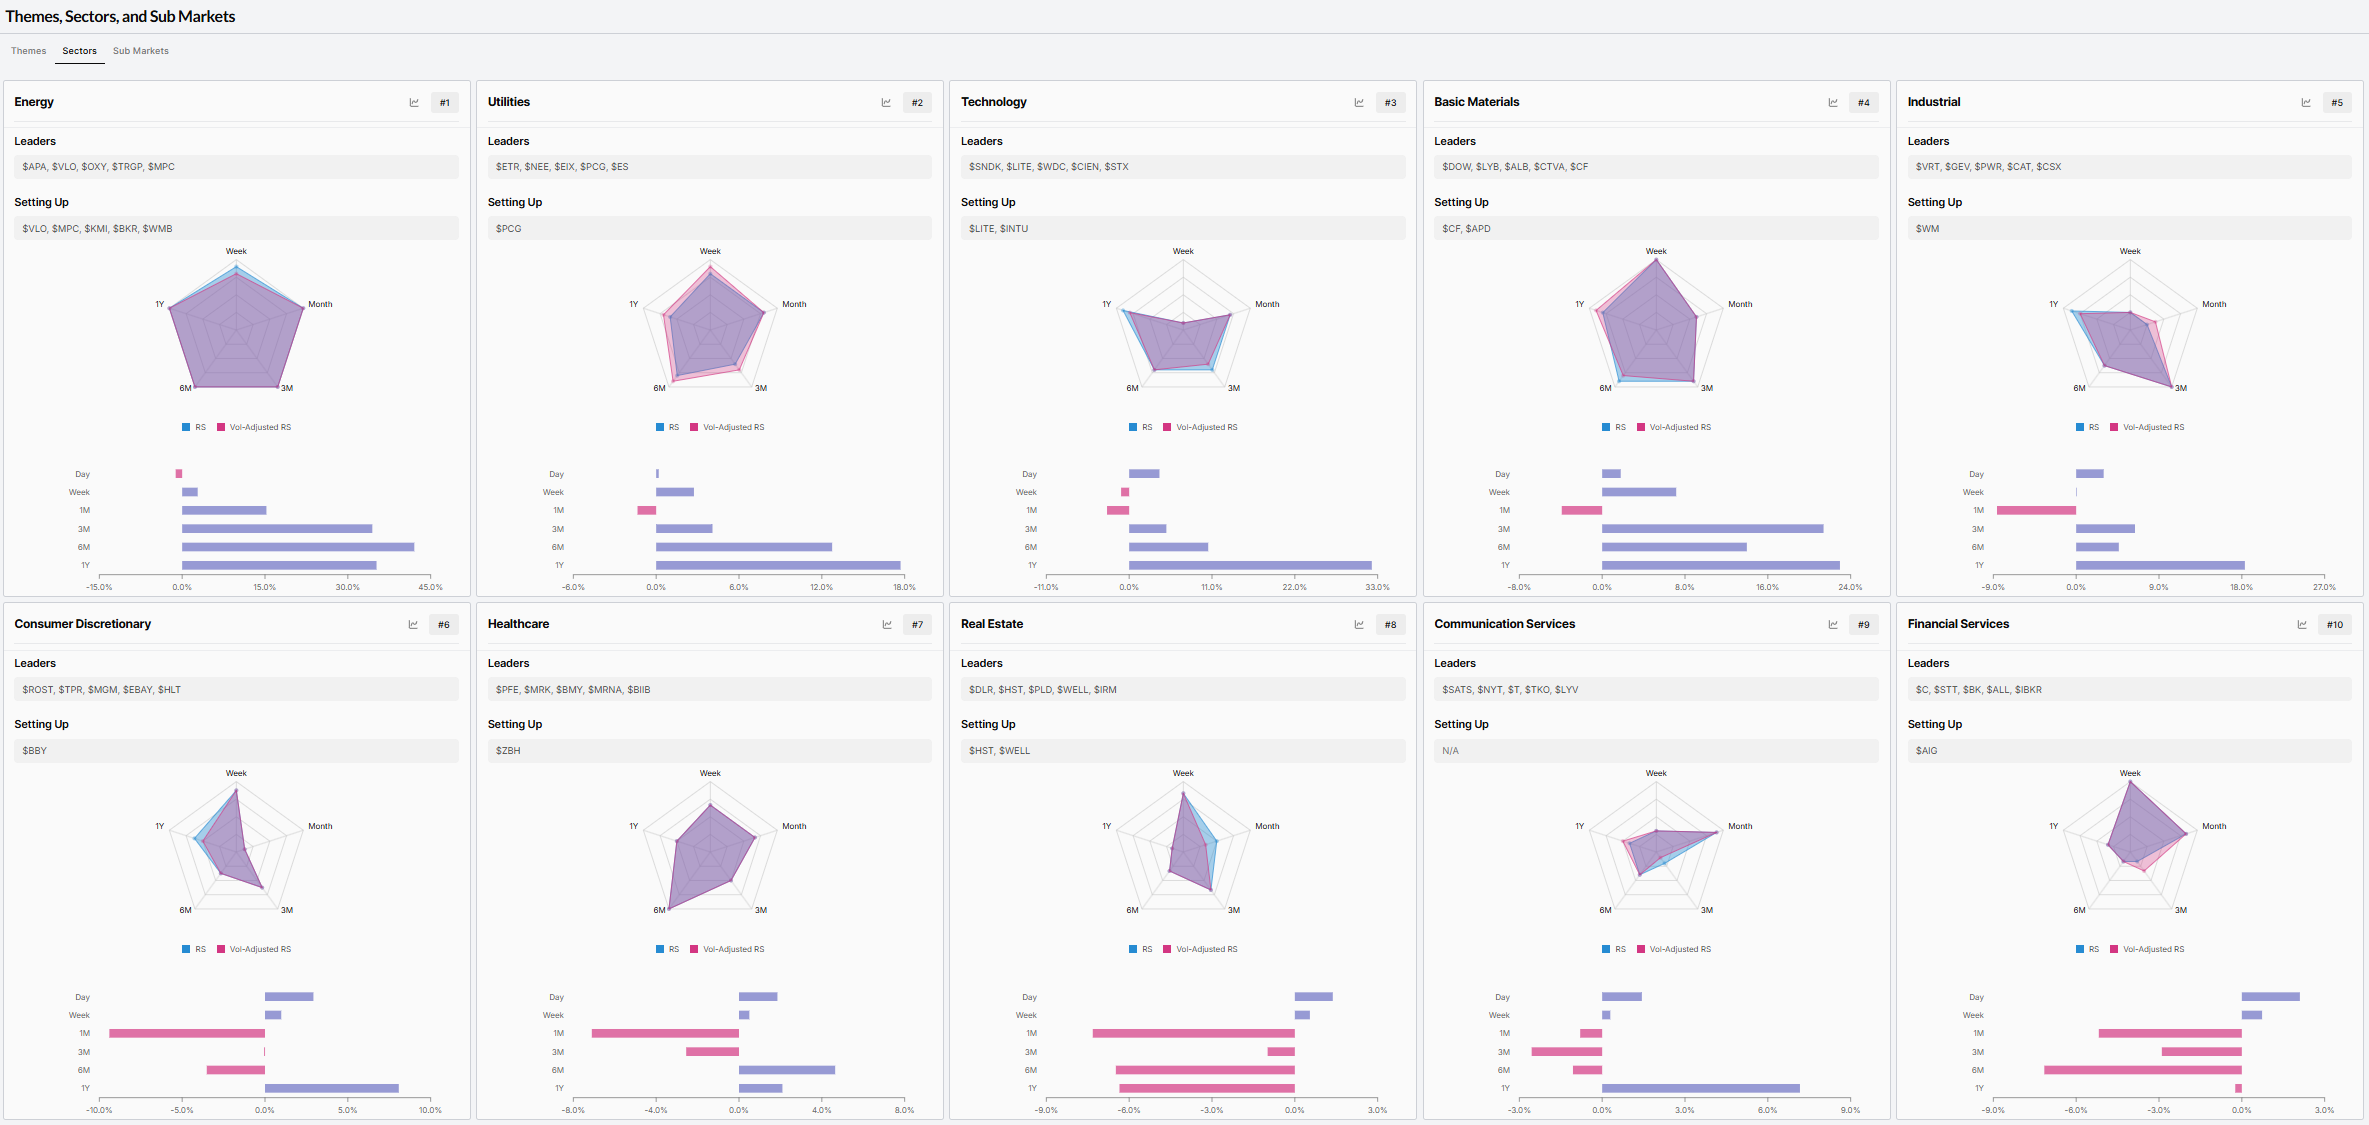
Top 10 Leading SECTORS - Relative Strength RANK sorted (W/ Leading & Setting up Stocks)
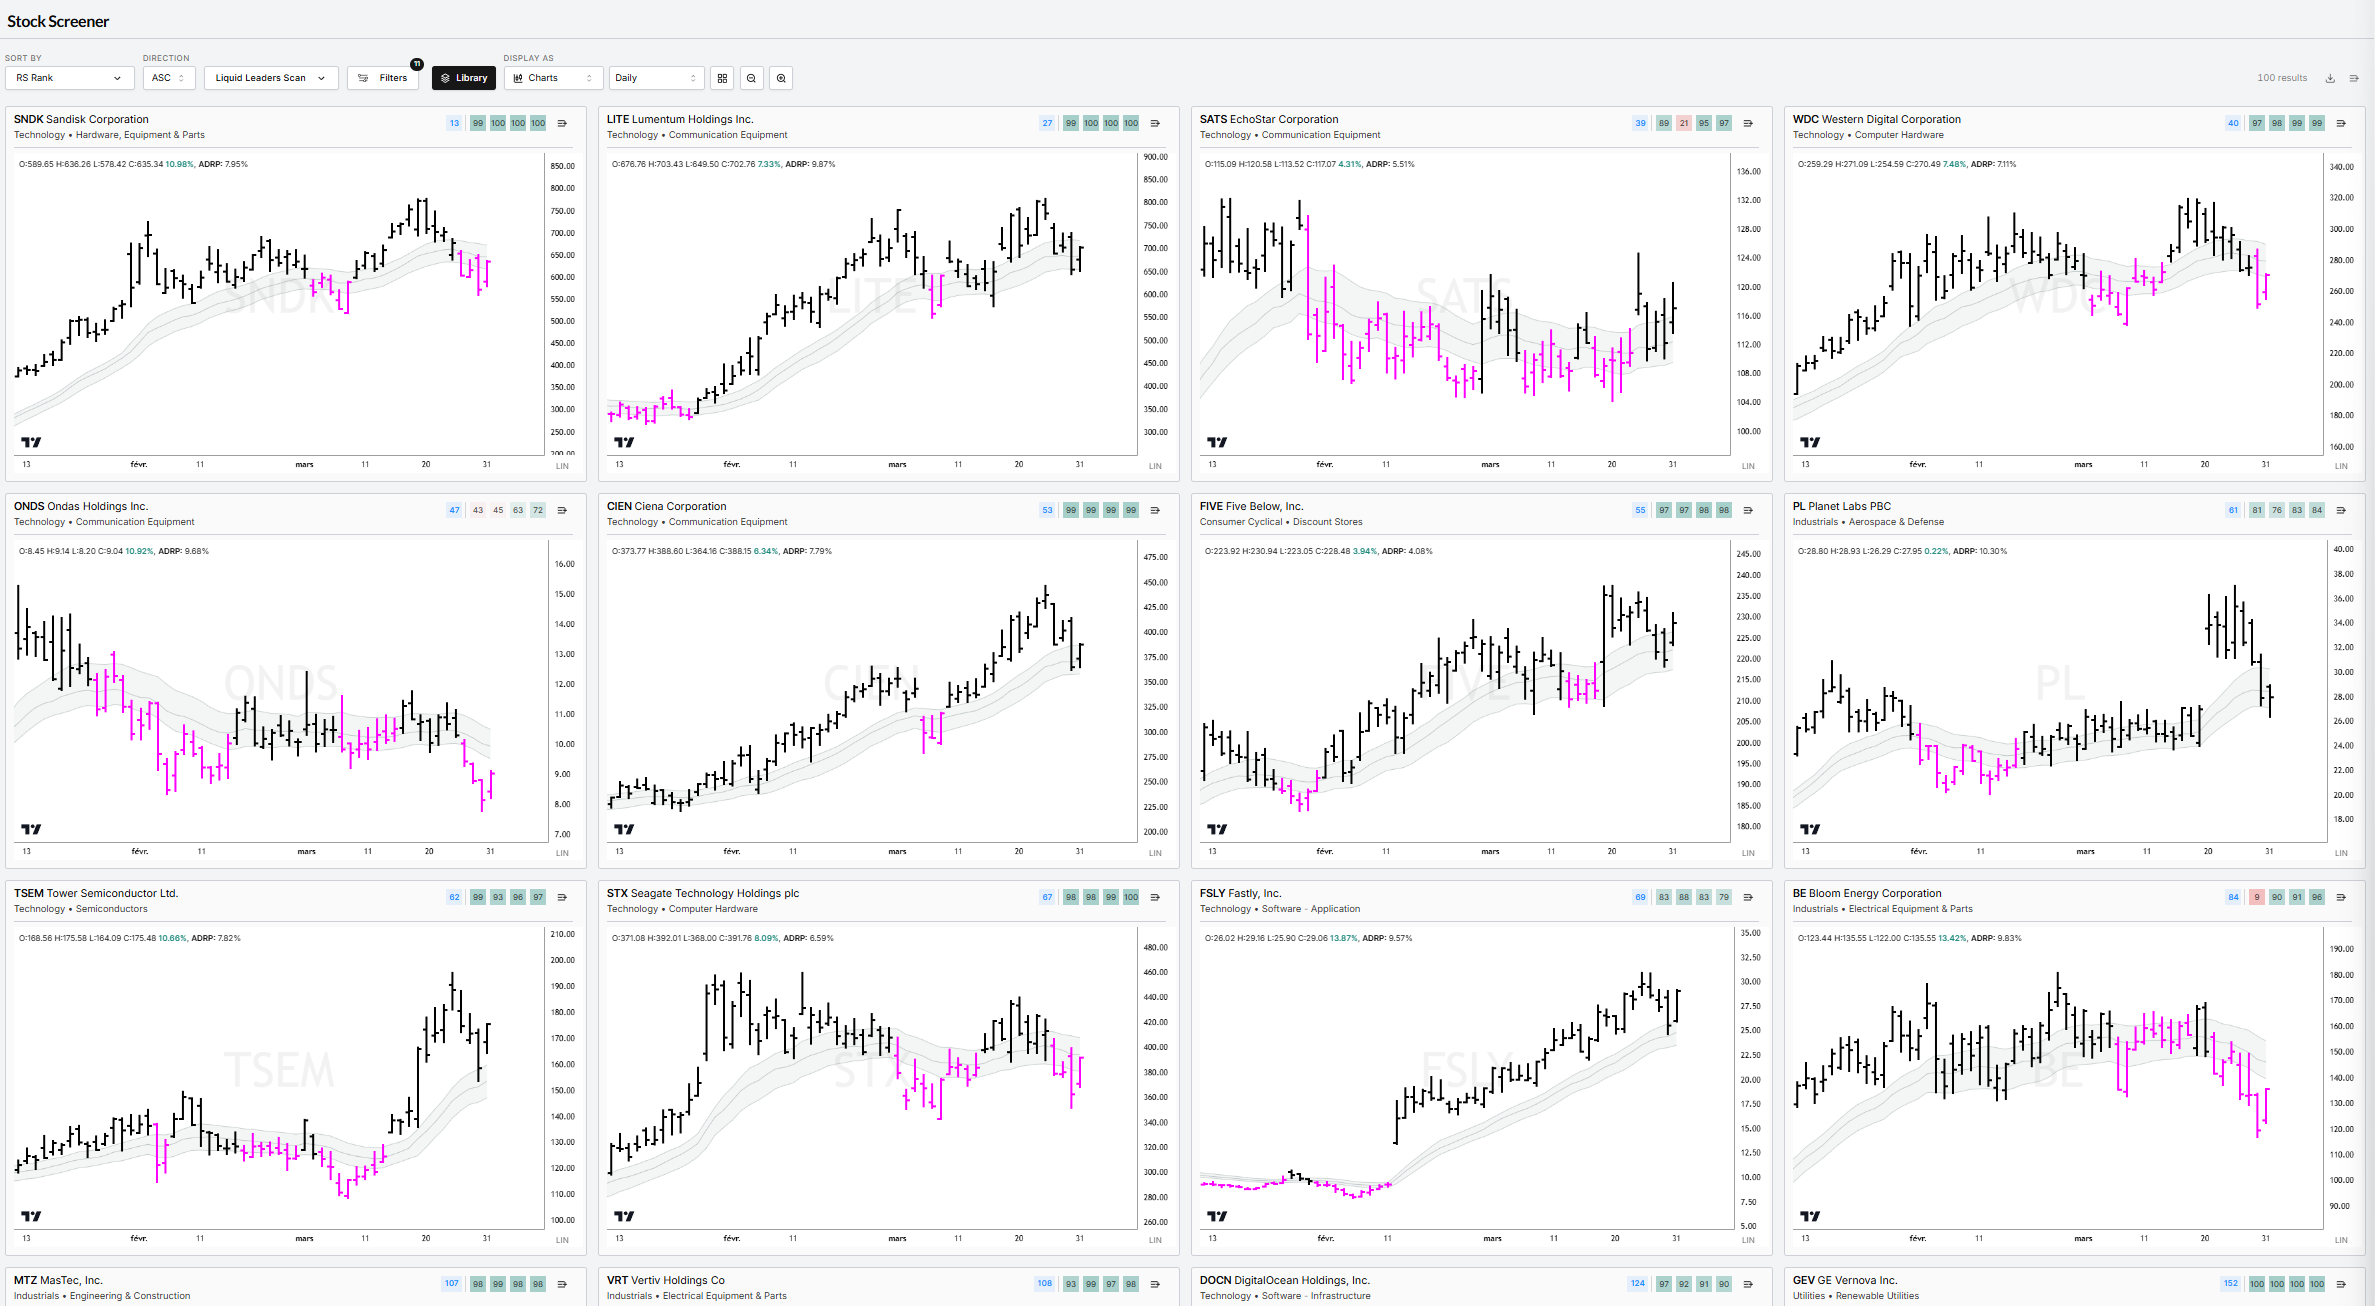
LEADERS STALKLIST
Liquid Leaders Universe (top RS)
SNDK, LITE, SATS, WDC, ONDS, CIEN, FIVE, PL, TSEM, STX, FSLY, BE, MTZ, VRT, DOCN, GEV, NBIS, TER, CLS, MKSI, ATI, MRVL, STM, NVT, MU, LRCX, COHR, JBL, PWR, APLD, CAT, GLW, DELL, AKAM, KLAC, AMAT, HPE, NOK, KEYS, MTSI, XPO, TPR, ASTS, ARM, RKLB, INTC, NET, ASML, DAL, FDX
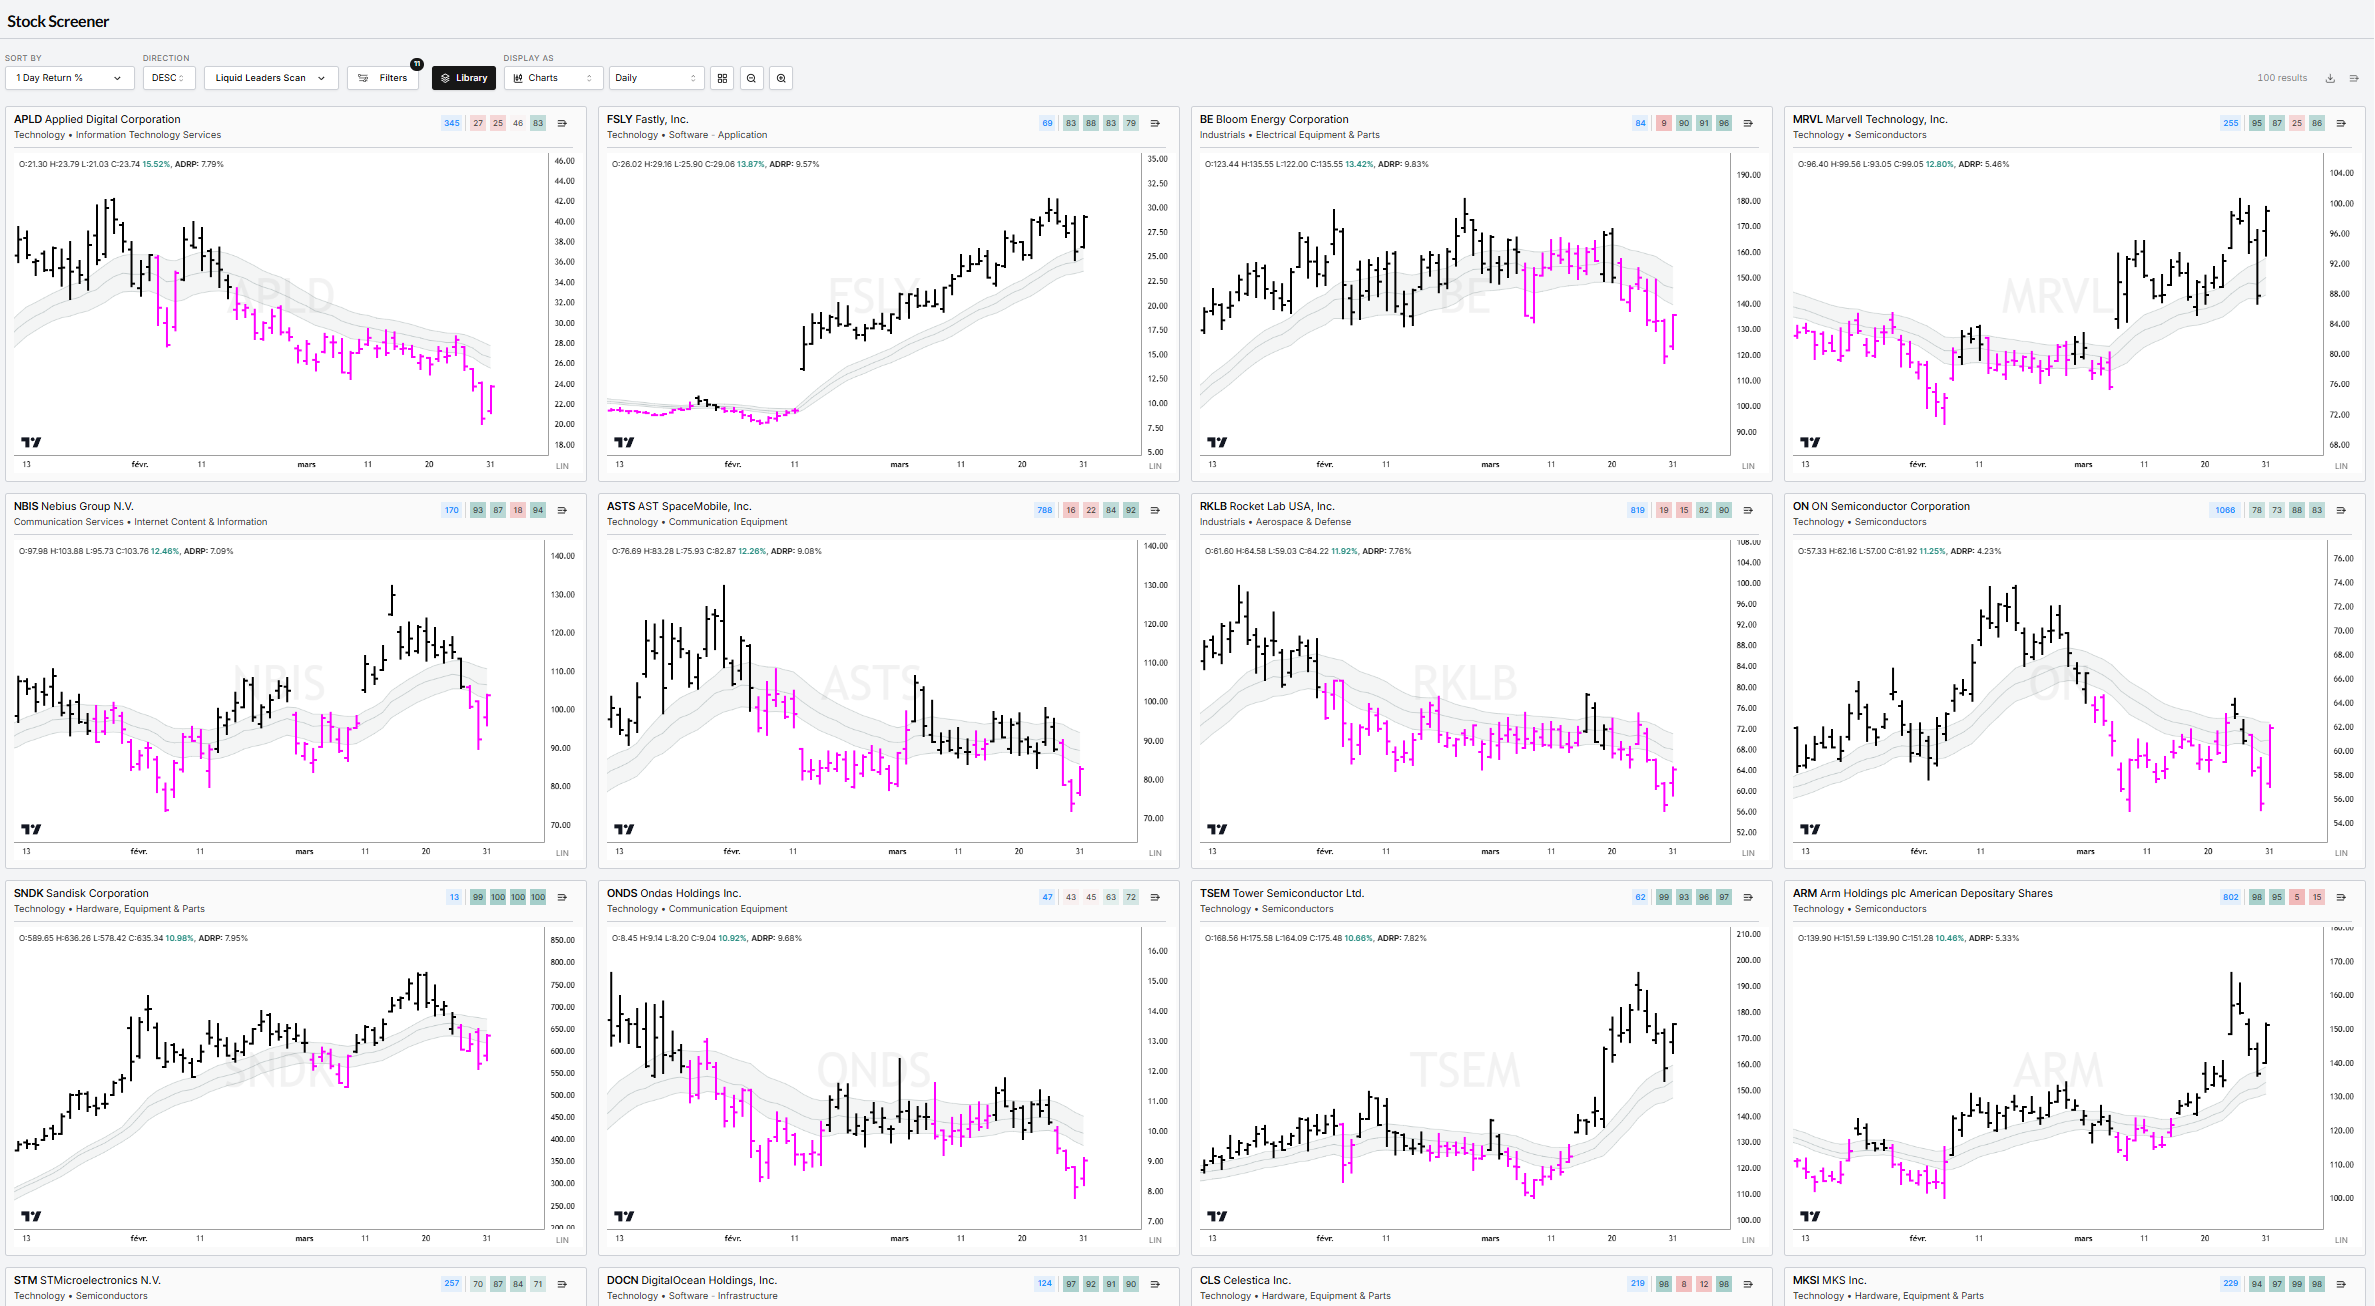
Liquid Leaders sorted by 1-Day Return (top daily RS)
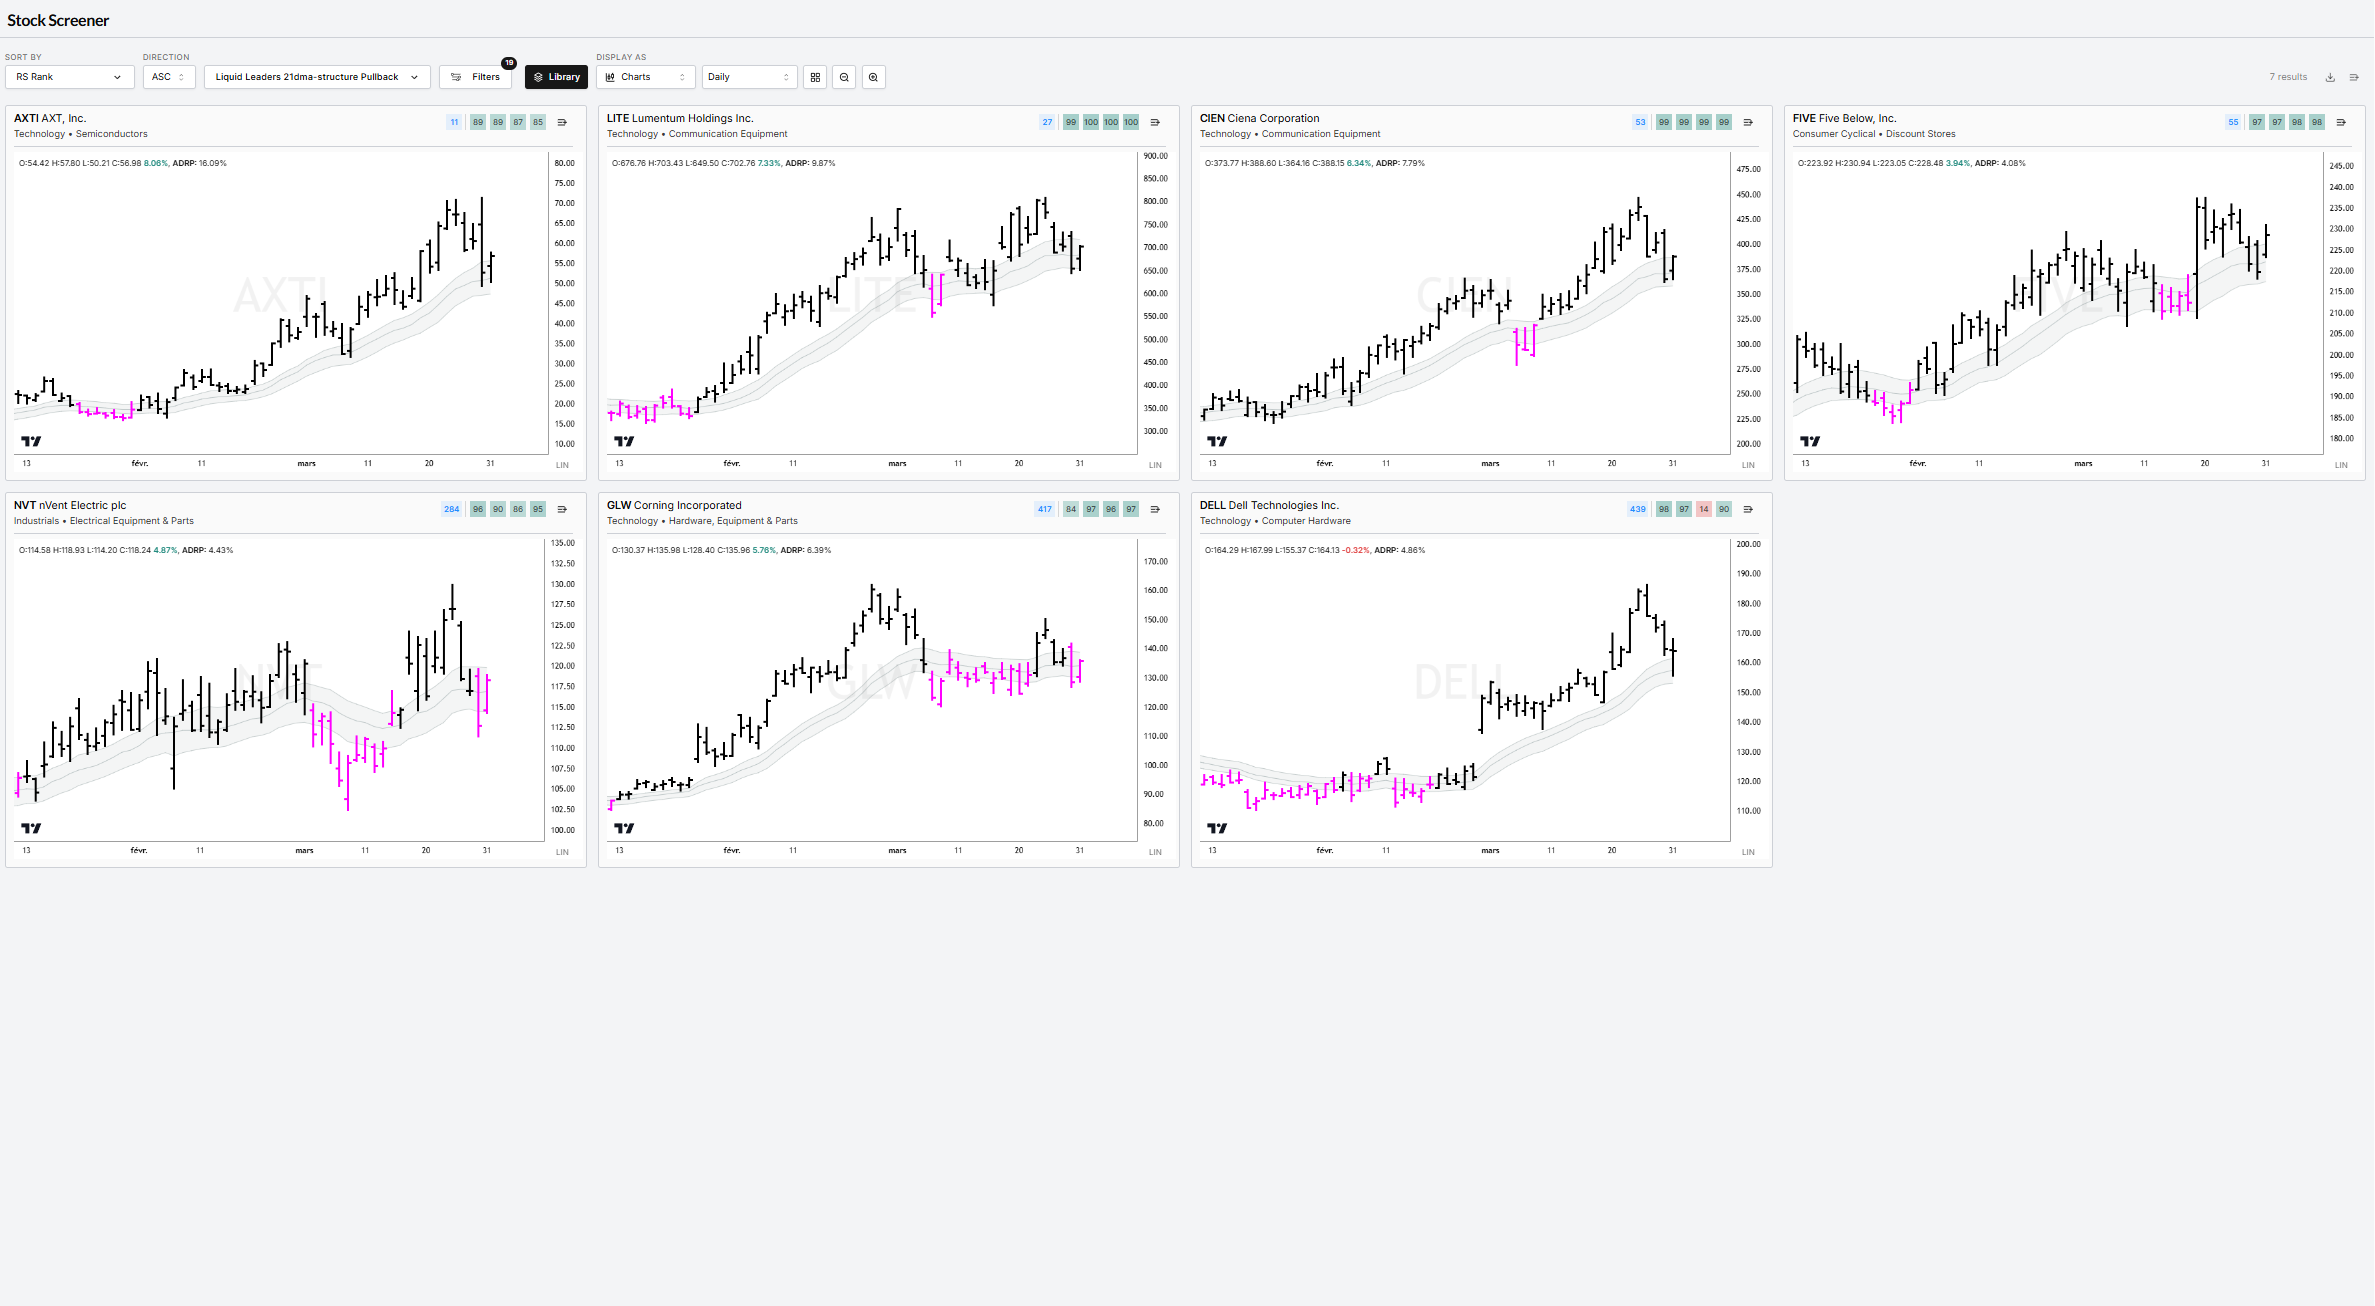
Liquid Leaders 21dma-structure Pullback scan (LONG)
AXTI, LITE, CIEN, FIVE, NVT, GLW, DELL
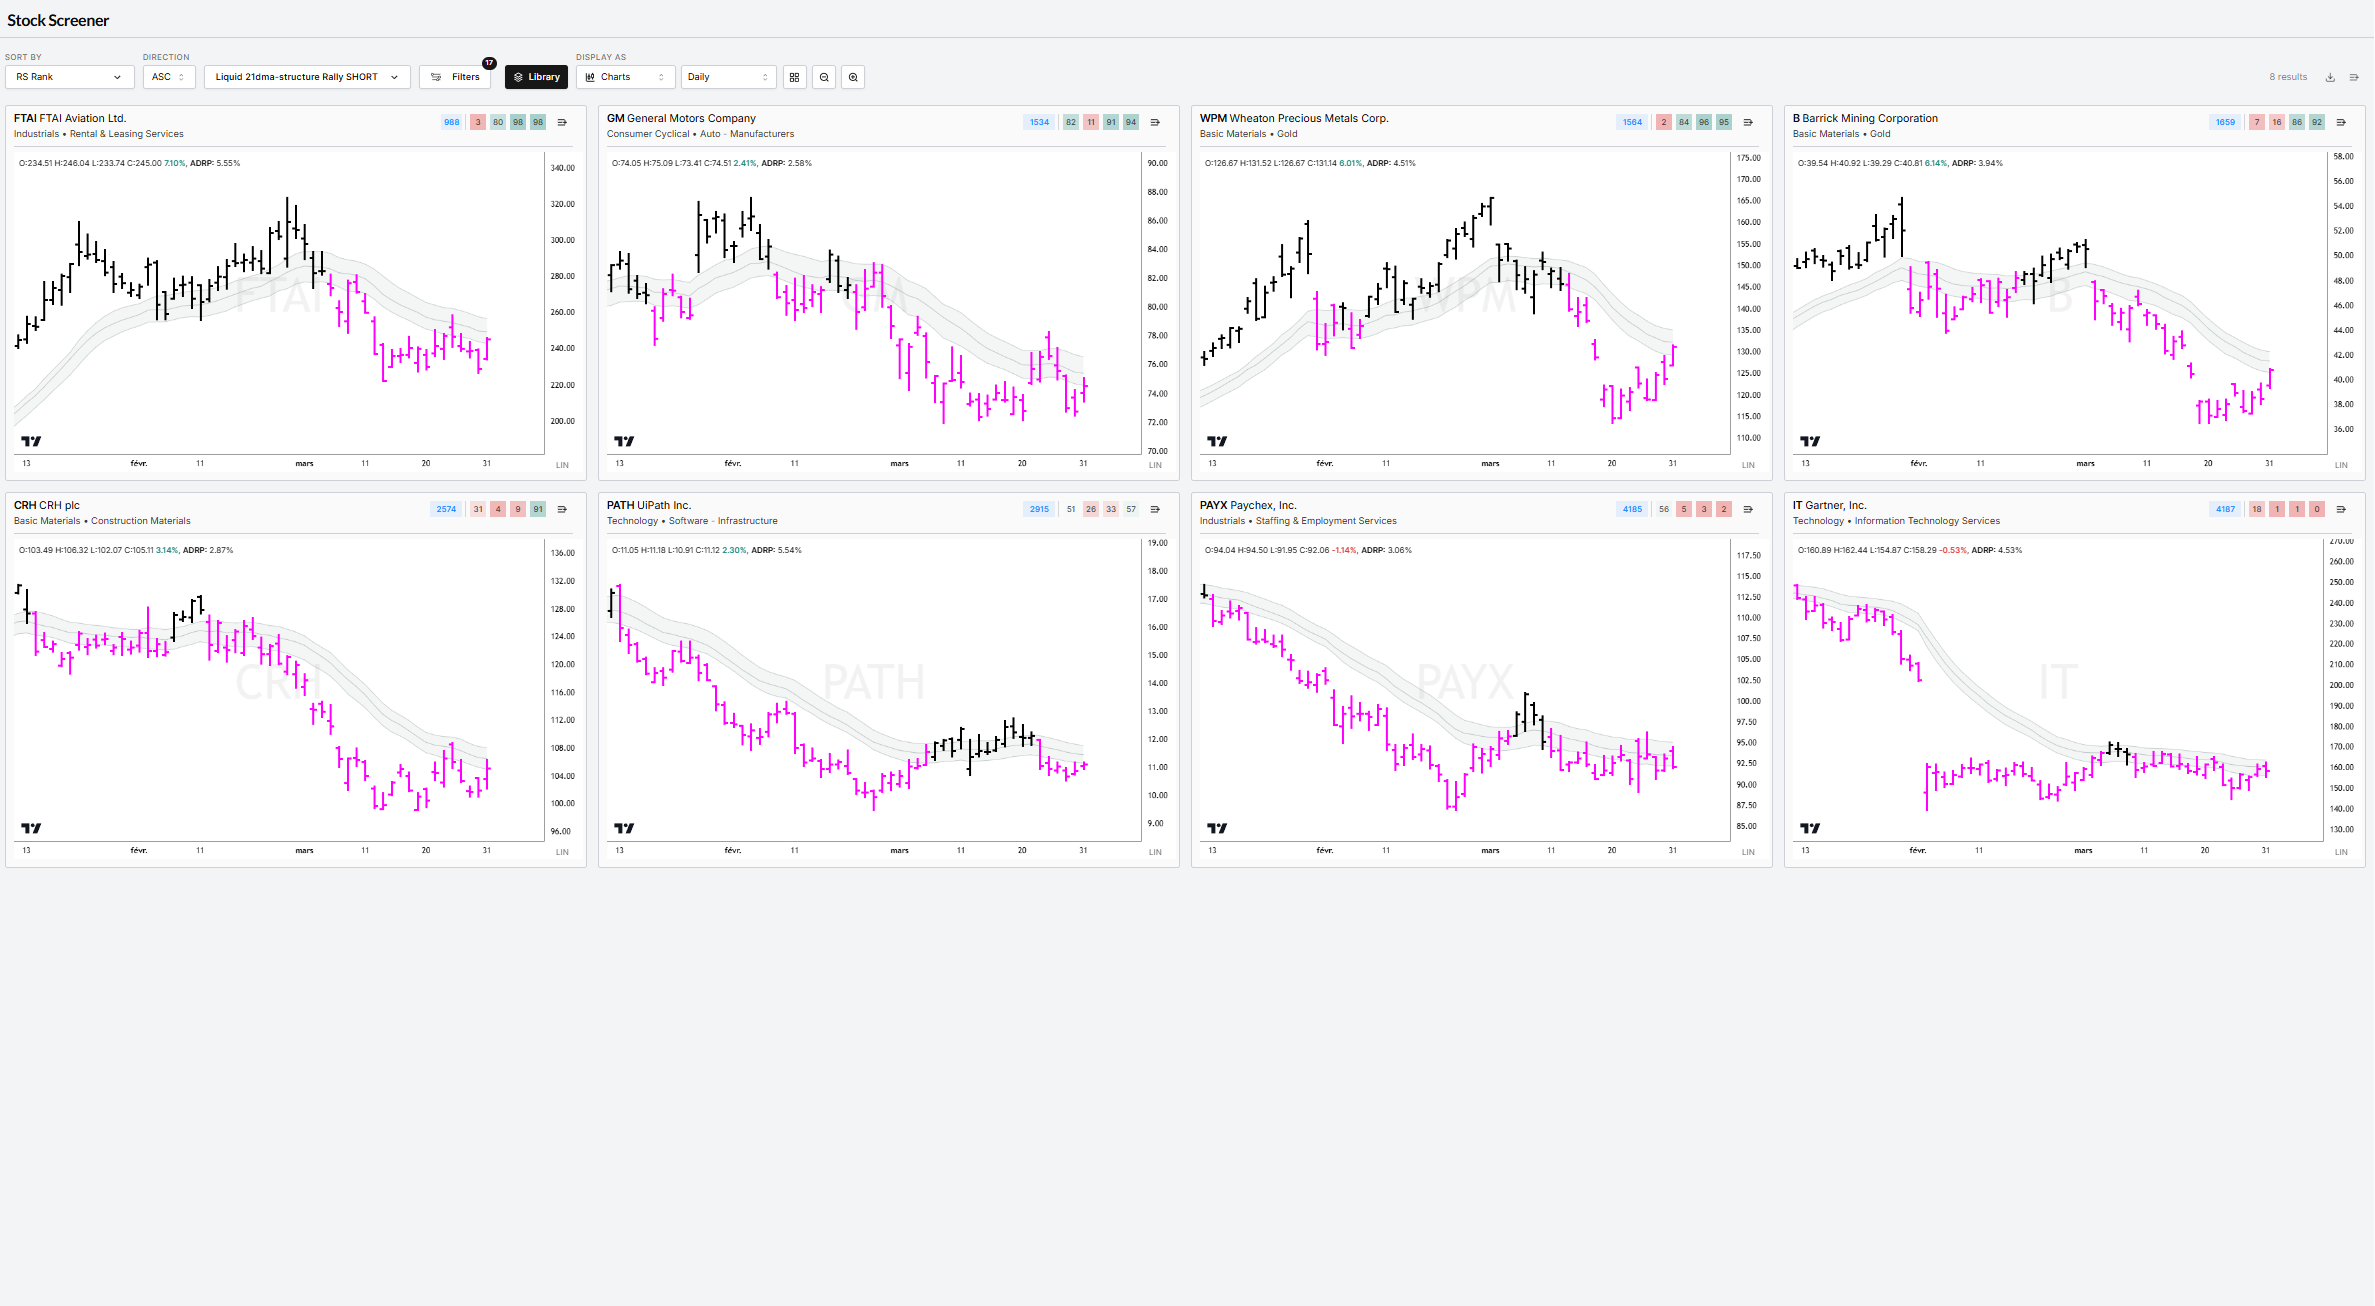
Liquid Leaders 21dma-structure Pullback scan (SHORT)
FTAI, GM, WPM, B, CRH, PATH, PAYX, IT