TRADING TERMS/CONCEPTS BEGINNER GUIDE (WIKI/GLOSSARY) 🔖
Definition & Meaning of all the trading terms & abbreviation you read in the PT Newsletters & Articles
At some point, we don’t realize how many trading-related abbreviations we use in our communication on a day-to-day basis. It’s only when new folks beginning in this business ask me what X or Y terms mean that I realize how confusing these terms could be to new folks.
So, with this article, I want to create a reference document containing all the TERMS, ABBREVIATIONS, and CONCEPTS I use in my daily letters & education articles.
NOTE: This article will be scalable and used as a reference document
Enjoy! ✌️
GENERAL TERMS GLOSSARY
10/21c - 10dma/21dma cloud
72/89c - 72dma/89dma cloud
AVWAP - Anchored Volume-Weighted Average Price
AH - After Hours
B/O - breakout
DMA - Daily Moving Average
DT - Downtrend
DTL - Down Trend Line
EC - Equity Curve
EMA - Exponential Moving Average
EOD - End of Day
ER - Earnings Report
ES/SPX/SPY - S&P500
FL - FocusList
FOMO - Fear of missing out
H&S - Head & Shoulder
HOD - High of Day (nHOD = new high of day)
IMO - In My Opinion
KMA’s - Key Moving Averages
LOD - Low of Day (nLOD = new low of the day)
LT - Long-Term
MC - Mental Capital
MT - Mid-Term
NNH - Net New High
NQ/NDX/QQQ - Nasdaq
OSC - Oscillator
P&L - Profit & Loss
PB - Pullback
PEG - Power Earnings Gap
Pre - Pre-market trades
R/R - Risk/Reward
RS - Relative Strength
RTY/RUT/IWM - Russel 2k
S/R - Support/Resistance
SHP - Swing High Pivot
SLP - Swing Low Pivot
SMA - Simple Moving Average
ST - Short-Term
U&R - Undercut & Rally
VWAP - Volume-Weighted Average Price
WMA - Weekly Moving Average
ALEX’S TECHNICAL SETUPS ACRONYMS
WB - Wedge break
WBPB - Wedge break pullback
BORS - Breakout Retest Short
BORL - Breakout Retest Long
BO10PB - Breakout 10ema PB
BO21PB - Breakout 21ema PB
BO72PB - Breakout 72/89ema PB
TRADING CONCEPTS
Area
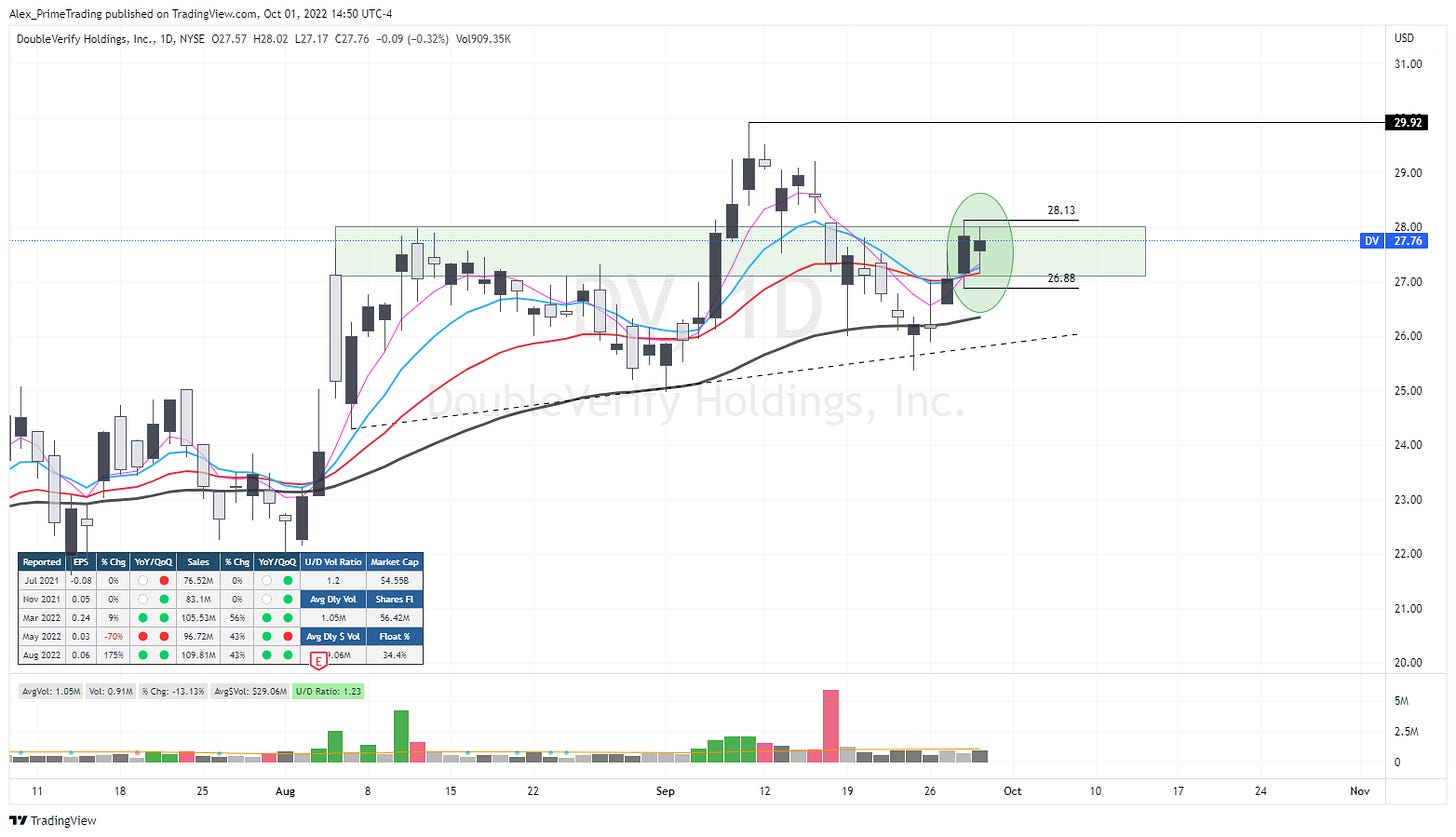
Two levels define a support/resistance area. Think of them as an area or even an elastic zone where the price can penetrate and overshoot but eventually find support or resistance.
Base area
The base area is either the TOP or BOTTOM area that conceals the multi-week or month consolidation. When the price goes at that top base area, it finds resistance, and when it goes at that bottom base area, it finds support.
Bounce
The term BOUNCE refers to the action of the price of a stock reversing, usually with momentum at a specific place (area, level, moving average, etc.).
e.g., Stock XYZ has bounced from the 10dma.
Breakdown
BREAKDOWN refers to a stock’s action to break below, usually on momentum/strength, a critical level/area/kma.
e.g., Stock XYZ has a breakdown from the base top level.
Breakeven
BREAKEVEN is when the price of a stock you are trading returns to your purchasing price.
e.g., My trade on XYZ is back to breakeven
Breakout
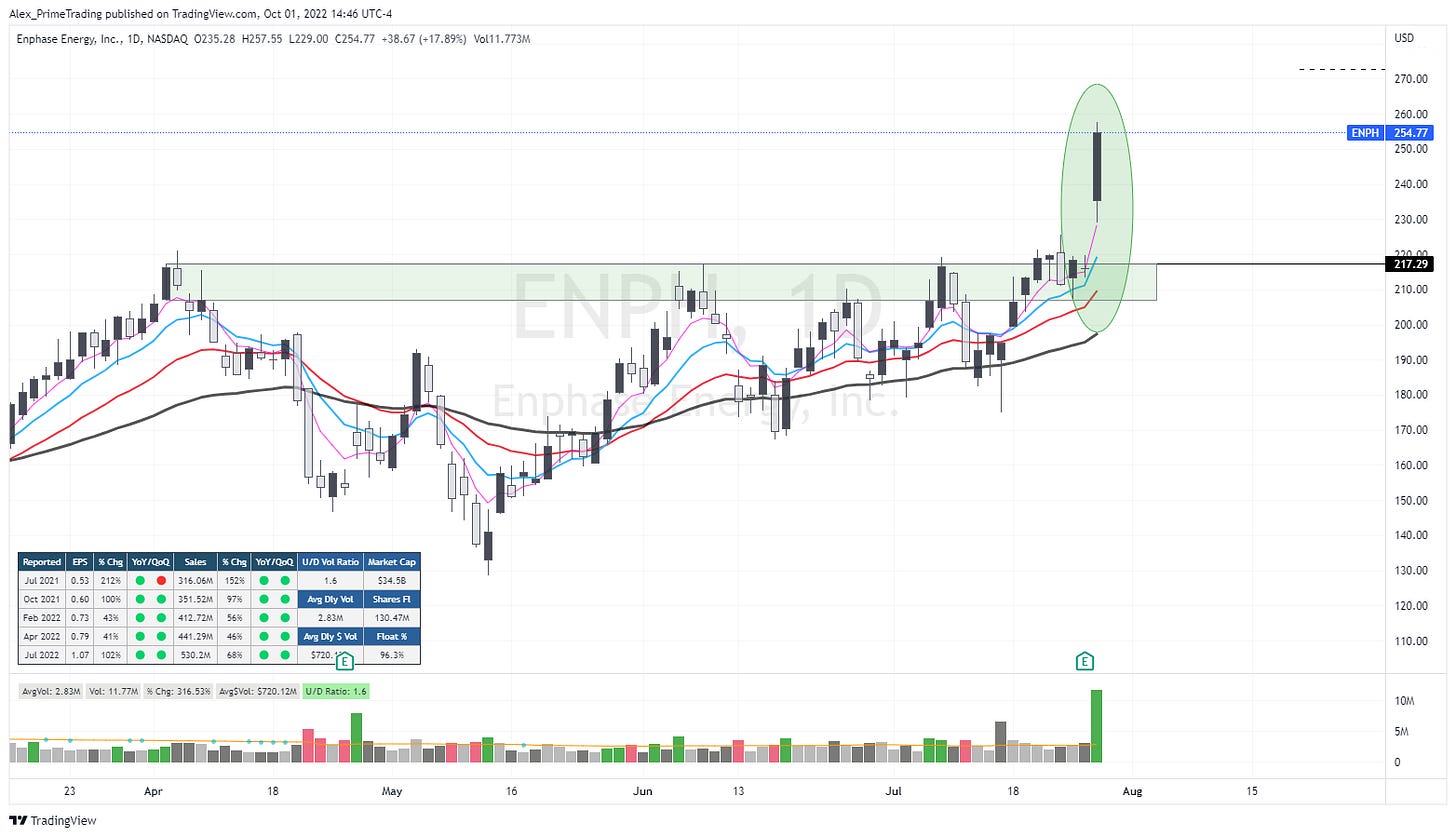
A BREAKOUT is when a stock finally exits a consolidation area and makes a new higher high.
e.g., Stock XYZ breakout of its multi-month base
Consolidation
After a price appreciation, A CONSOLIDATION is when a stock stays within a range or pullback over multiple weeks or months. It can be sideways or with a small declining action back to a critical level or kma.
e.g., Stock XYZ breakout of its multi-month base
Divergence
When two instruments or metrics are used to move in the same direction and suddenly move in the opposite direction, then we say this is a DIVERGENCE.
Down Trend Line (DTL)
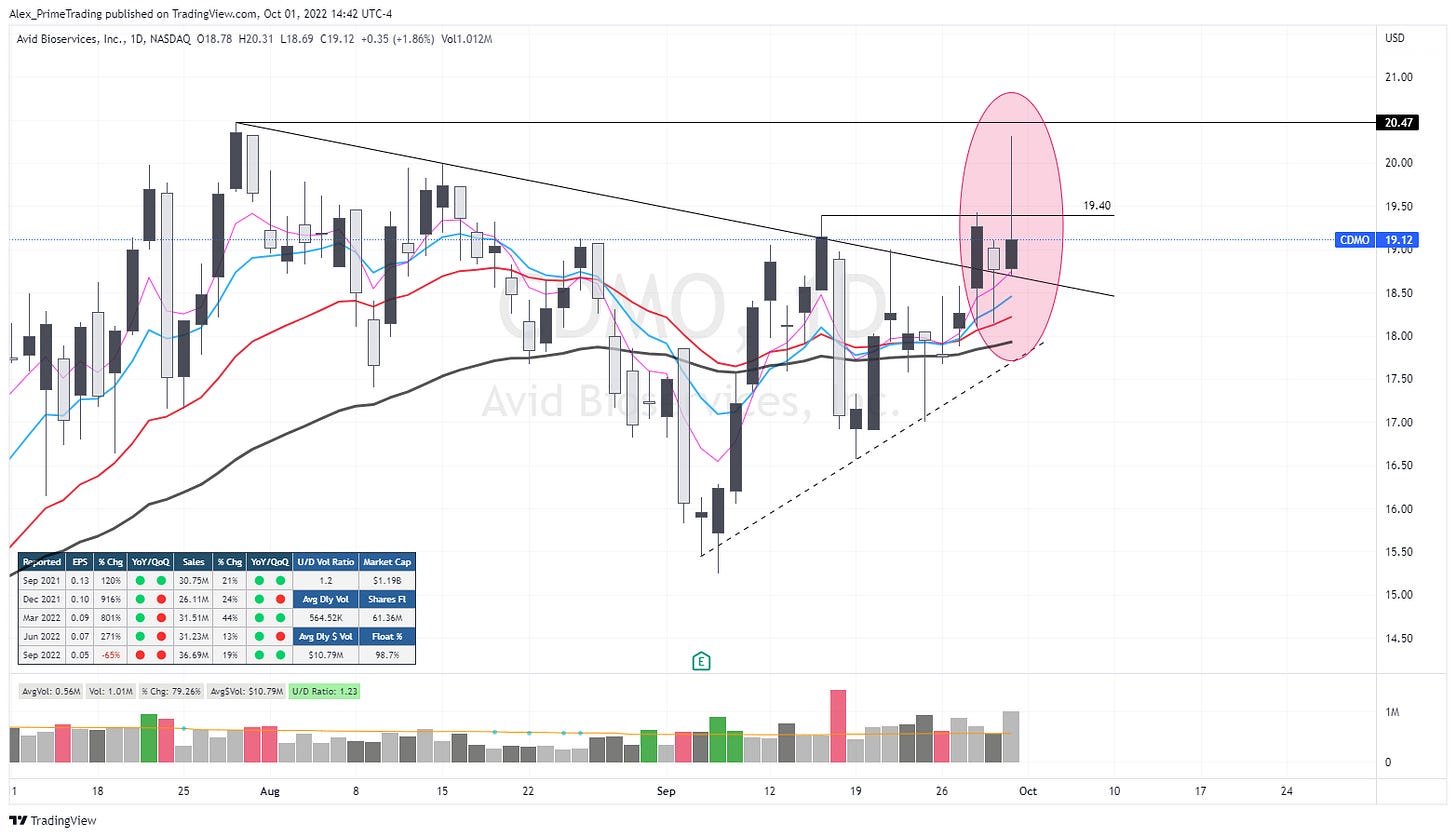
A DTL is a down-slopping line that encloses most of the highs and most of the price action during a pullback/consolidation.
e.g., Stock XYZ breakout of the DTL
Failed breakout
A failed breakout occurs when the stock breakout from a pivot or an important level/area only to find resistance and finally close back below that entry pivot.
e.g., Stock XYZ failed his breakout and closed back below the entry pivot
Follow-through
When a breakout occurs, one significant action we want to see is a continuing upside action on the following day. Seeing a higher volume on the second day (follow-through) is also a characteristic we want to see, as it confirms the interest and the buying of the stock out of the setup.
Gap-down
A gap-down is when a stock opens lower than where it closed the day prior. This happens when news, report, or any information affects the business's valuation. This is my worst nightmare… :)
Gap-up
A gap-up is when a stock opens higher than where it closed the day prior. This happens when news, report, or any information affects the business's valuation.
Higher High (HH)
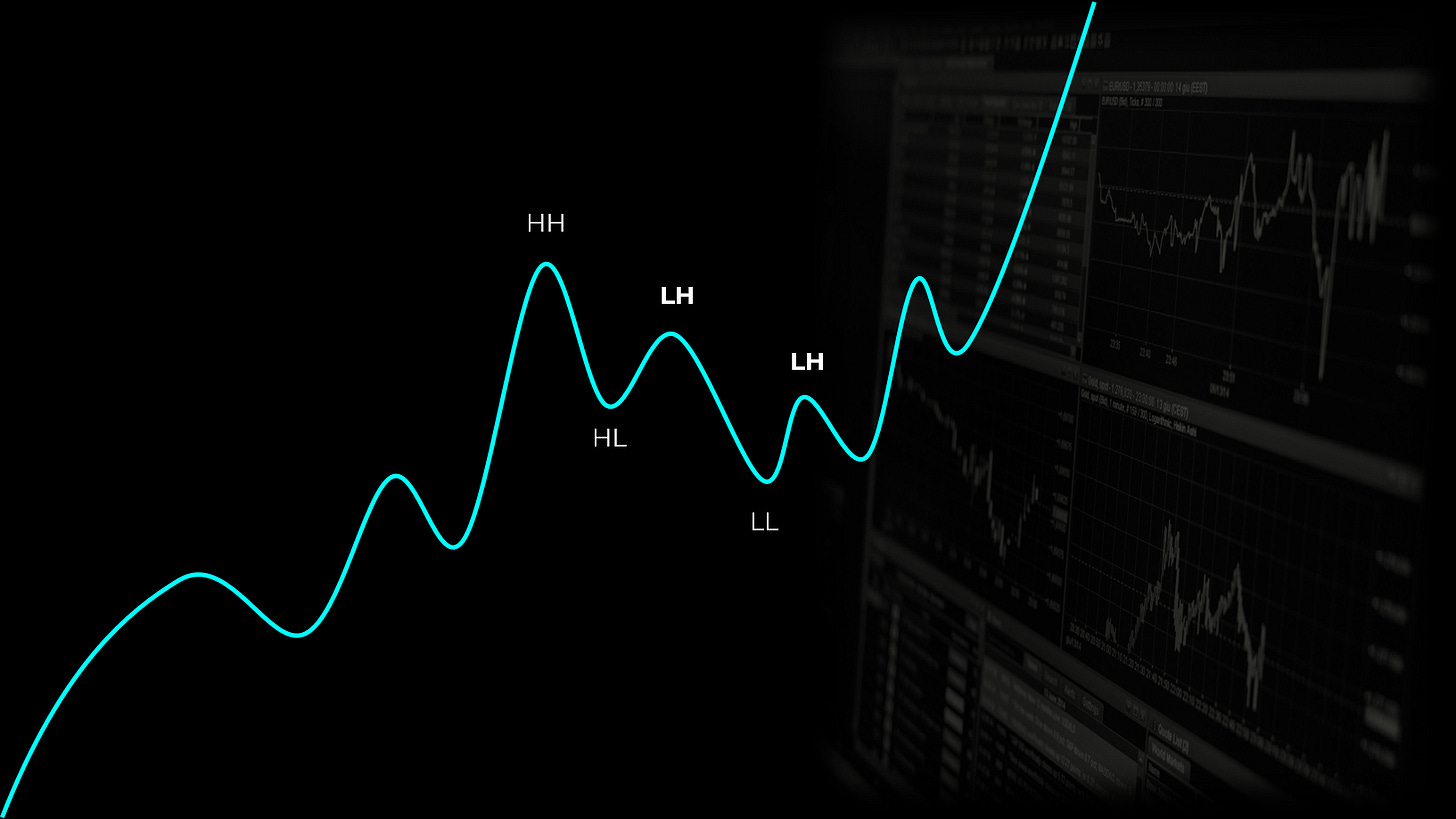
If the stock breakout above our most recent swing high, which was the last LOWER HIGH (LH) in our pullback structure, THEN our next swing will create a new HIGHER HIGH (HH).
Inside day
An inside day is when the price action (high-low) is contained inside the previous day’s price action (high-low).
Lower High (LH)
When the stock starts to pull back and then rally but can’t return to the previous swing high, we say that this new high is “lower.” Hence a Lower High (LH).
Lower Low (LL)
When a pullback occurs, and the price makes a new low below the previous low in the structure, then we say that this unique point is a Lower Low (LL)
Measured Move
The market loves to move in equal distance moves. Something to look for during a correction or pullback is a down leg #1 being of equal distance as the down leg #2… typically when we get in this area, we see a bounce.
New High
A new high is when a stock price goes higher than the previous highest price of any past period. It could be the highest price for the last month, 6 months, or 52 weeks.
e.g., Stock XYZ made a new 52w high
New Low
A new low is when a stock price goes lower than the previous lowest price of any past period. It could be the highest price for the last month, 6 months, or 52 weeks.
e.g., Stock XYZ made a new 52w low
Pivot
Reclaim
Once a stock broke below a pivot, level, or area and came right back above it, we say that it “reclaimed” that level.
e.g., Stock XYZ reclaimed its base support area
Rejected
When a stock breaks an important S/R area and cannot reclaim it, and instead gets rejected by it on that retest…we say that it has been rejected.
e.g., Stock XYZ got rejected at its base area
Relative Strength (RS)
Relative Strength (Not the Relative Strength Index RSI) is the individual performance of a group of assets compared to a benchmark, usually the S&P500 (SPY). For example, we use this metric to know which assets hold and held the best during a market correction.
Resistance
Resistance is a level or area where the selling pressure becomes more important than the buying and acts as a “resistance” to push the stock price back down. We are looking for reversal & rejection in these areas unless they reclaim it.
Retest
Once an area has been breached (from either side) we normally see the price coming back to “retest” that area. If we get rejected, then that’s when this area will flip from support to resistance or vice versa. This offers a great low-risk entry as we gain confirmation from that particular action.
Scale-in
“Scaling-in” a position means that we begin with a small initial position, and we add additional shares as the stock increase in price over time. Building a bigger position as we get confirmation that the stock is going up.
e.g., I’m scaling in my stock XYZ trade
Scale-out
“Scaling-out” of a position means that we sell parts of a position as a stock increases in price over time.
e.g., I’m scaling out of my stock XYZ trade
Support
Support is a level or area where the buying pressure becomes more important than the selling and acts as a “support” to push the stock price back up. We are looking for reversal & bounce in these areas unless they break and can’t bounce.
Swing high
A swing high is the highest price of a price thrust upward (leg up). They can be either a Higher High (HH) or Lower High (LH).
Swing low
A swing low is the lowest price of a price thrust downward (leg down). They can be either a Higher Low (HL) or Lower Low (LL).
Trend
A trend is the action of a stock to have a sustained and prolonged move up, or down. When a stock is showing this type of action, we say that this is “trending”.
Up Trend Line (UTL)
A UTL is a up-slopping line that encloses most of the lows and most of the price action during a rally/bounce or even a trend.
I hope you liked this article! Let me know your thoughts in the comments below.
Here is what you can do to help make them possible and support my work.
Leave a like on this post below.
Share this post on Twitter using the button below.
Alex ✌️🛡️









Any chance you could make this a pdf or file that can easily be saved on a desktop??? Please, pretty please.
Helpful!